
Advertisement
Revenues Not Telling The Story For Shanghai Anoky Group Co., Ltd (SZSE:300067) After Shares Rise 27%
Shanghai Anoky Group Co., Ltd (SZSE:300067) shares have had a really impressive month, gaining 27% after a shaky period beforehand. Looking back a bit further, it's encouraging to see the stock is up 48% in the last year.
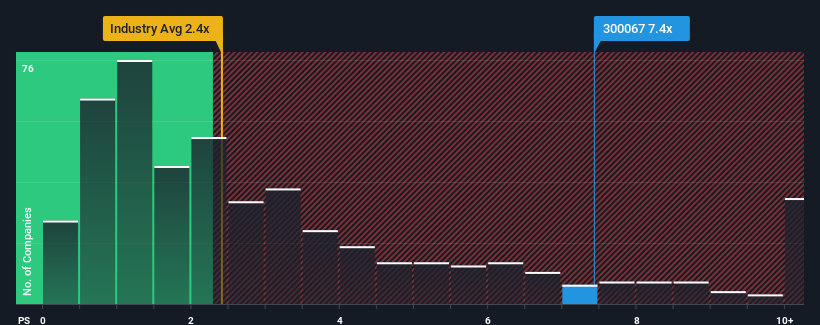
Following the firm bounce in price, when almost half of the companies in China's Chemicals industry have price-to-sales ratios (or "P/S") below 2.4x, you may consider Shanghai Anoky Group as a stock not worth researching with its 7.4x P/S ratio. Nonetheless, we'd need to dig a little deeper to determine if there is a rational basis for the highly elevated P/S.
See our latest analysis for Shanghai Anoky Group
What Does Shanghai Anoky Group's Recent Performance Look Like?
The revenue growth achieved at Shanghai Anoky Group over the last year would be more than acceptable for most companies. It might be that many expect the respectable revenue performance to beat most other companies over the coming period, which has increased investors’ willingness to pay up for the stock. If not, then existing shareholders may be a little nervous about the viability of the share price.
We don't have analyst forecasts, but you can see how recent trends are setting up the company for the future by checking out our free report on Shanghai Anoky Group's earnings, revenue and cash flow.What Are Revenue Growth Metrics Telling Us About The High P/S?
In order to justify its P/S ratio, Shanghai Anoky Group would need to produce outstanding growth that's well in excess of the industry.
If we review the last year of revenue growth, the company posted a terrific increase of 30%. Despite this strong recent growth, it's still struggling to catch up as its three-year revenue frustratingly shrank by 9.1% overall. Therefore, it's fair to say the revenue growth recently has been undesirable for the company.
Comparing that to the industry, which is predicted to deliver 24% growth in the next 12 months, the company's downward momentum based on recent medium-term revenue results is a sobering picture.
With this information, we find it concerning that Shanghai Anoky Group is trading at a P/S higher than the industry. It seems most investors are ignoring the recent poor growth rate and are hoping for a turnaround in the company's business prospects. Only the boldest would assume these prices are sustainable as a continuation of recent revenue trends is likely to weigh heavily on the share price eventually.
The Bottom Line On Shanghai Anoky Group's P/S
Shanghai Anoky Group's P/S has grown nicely over the last month thanks to a handy boost in the share price. We'd say the price-to-sales ratio's power isn't primarily as a valuation instrument but rather to gauge current investor sentiment and future expectations.
We've established that Shanghai Anoky Group currently trades on a much higher than expected P/S since its recent revenues have been in decline over the medium-term. When we see revenue heading backwards and underperforming the industry forecasts, we feel the possibility of the share price declining is very real, bringing the P/S back into the realm of reasonability. If recent medium-term revenue trends continue, it will place shareholders' investments at significant risk and potential investors in danger of paying an excessive premium.
It is also worth noting that we have found 4 warning signs for Shanghai Anoky Group (3 shouldn't be ignored!) that you need to take into consideration.
If companies with solid past earnings growth is up your alley, you may wish to see this free collection of other companies with strong earnings growth and low P/E ratios.
New: Manage All Your Stock Portfolios in One Place
We've created the ultimate portfolio companion for stock investors, and it's free.
• Connect an unlimited number of Portfolios and see your total in one currency
• Be alerted to new Warning Signs or Risks via email or mobile
• Track the Fair Value of your stocks
Have feedback on this article? Concerned about the content? Get in touch with us directly. Alternatively, email editorial-team (at) simplywallst.com.
This article by Simply Wall St is general in nature. We provide commentary based on historical data and analyst forecasts only using an unbiased methodology and our articles are not intended to be financial advice. It does not constitute a recommendation to buy or sell any stock, and does not take account of your objectives, or your financial situation. We aim to bring you long-term focused analysis driven by fundamental data. Note that our analysis may not factor in the latest price-sensitive company announcements or qualitative material. Simply Wall St has no position in any stocks mentioned.
About SZSE:300067
Shanghai Anoky Group
Provides dyeing and finishing solutions for textile fabrics and special needs in China and internationally.
Mediocre balance sheet with minimal risk.
Market Insights

Advertisement
Community Narratives
A formidable player in AI and enterprise computing.
Fair Value US$210.00|13.6% overvalued
CO
Community Contributor
IREN's Bold Moves in Sustainable Bitcoin Mining & AI Data Centers
Fair Value US$89.00|23.6% undervalued
BL
Community Contributor
Cooling the Champions: The Aussie Tech Behind F1's Victories
Fair Value AU$12.40|37.6% undervalued
TR
Community Contributor