Here's What's Concerning About Xinjiang Zhongtai Chemical's (SZSE:002092) Returns On Capital


There are a few key trends to look for if we want to identify the next multi-bagger. Firstly, we'll want to see a proven return on capital employed (ROCE) that is increasing, and secondly, an expanding base of capital employed. This shows us that it's a compounding machine, able to continually reinvest its earnings back into the business and generate higher returns. In light of that, when we looked at Xinjiang Zhongtai Chemical (SZSE:002092) and its ROCE trend, we weren't exactly thrilled.
What Is Return On Capital Employed (ROCE)?
Just to clarify if you're unsure, ROCE is a metric for evaluating how much pre-tax income (in percentage terms) a company earns on the capital invested in its business. The formula for this calculation on Xinjiang Zhongtai Chemical is:
Return on Capital Employed = Earnings Before Interest and Tax (EBIT) ÷ (Total Assets - Current Liabilities)
0.016 = CN¥724m ÷ (CN¥77b - CN¥33b) (Based on the trailing twelve months to December 2024).
Therefore, Xinjiang Zhongtai Chemical has an ROCE of 1.6%. In absolute terms, that's a low return and it also under-performs the Chemicals industry average of 5.6%.
Check out our latest analysis for Xinjiang Zhongtai Chemical
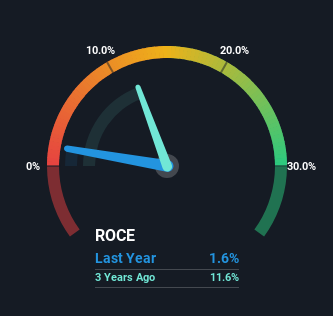
Historical performance is a great place to start when researching a stock so above you can see the gauge for Xinjiang Zhongtai Chemical's ROCE against it's prior returns. If you want to delve into the historical earnings , check out these free graphs detailing revenue and cash flow performance of Xinjiang Zhongtai Chemical.
So How Is Xinjiang Zhongtai Chemical's ROCE Trending?
In terms of Xinjiang Zhongtai Chemical's historical ROCE movements, the trend isn't fantastic. To be more specific, ROCE has fallen from 5.9% over the last five years. Given the business is employing more capital while revenue has slipped, this is a bit concerning. This could mean that the business is losing its competitive advantage or market share, because while more money is being put into ventures, it's actually producing a lower return - "less bang for their buck" per se.
On a side note, Xinjiang Zhongtai Chemical's current liabilities are still rather high at 43% of total assets. This effectively means that suppliers (or short-term creditors) are funding a large portion of the business, so just be aware that this can introduce some elements of risk. Ideally we'd like to see this reduce as that would mean fewer obligations bearing risks.
Our Take On Xinjiang Zhongtai Chemical's ROCE
In summary, we're somewhat concerned by Xinjiang Zhongtai Chemical's diminishing returns on increasing amounts of capital. And long term shareholders have watched their investments stay flat over the last five years. Unless there is a shift to a more positive trajectory in these metrics, we would look elsewhere.
If you want to continue researching Xinjiang Zhongtai Chemical, you might be interested to know about the 2 warning signs that our analysis has discovered.
While Xinjiang Zhongtai Chemical may not currently earn the highest returns, we've compiled a list of companies that currently earn more than 25% return on equity. Check out this free list here.
If you're looking to trade Xinjiang Zhongtai Chemical, open an account with the lowest-cost platform trusted by professionals, Interactive Brokers.
With clients in over 200 countries and territories, and access to 160 markets, IBKR lets you trade stocks, options, futures, forex, bonds and funds from a single integrated account.
Enjoy no hidden fees, no account minimums, and FX conversion rates as low as 0.03%, far better than what most brokers offer.
Sponsored ContentNew: AI Stock Screener & Alerts
Our new AI Stock Screener scans the market every day to uncover opportunities.
• Dividend Powerhouses (3%+ Yield)
• Undervalued Small Caps with Insider Buying
• High growth Tech and AI Companies
Or build your own from over 50 metrics.
Have feedback on this article? Concerned about the content? Get in touch with us directly. Alternatively, email editorial-team (at) simplywallst.com.
This article by Simply Wall St is general in nature. We provide commentary based on historical data and analyst forecasts only using an unbiased methodology and our articles are not intended to be financial advice. It does not constitute a recommendation to buy or sell any stock, and does not take account of your objectives, or your financial situation. We aim to bring you long-term focused analysis driven by fundamental data. Note that our analysis may not factor in the latest price-sensitive company announcements or qualitative material. Simply Wall St has no position in any stocks mentioned.
About SZSE:002092
Xinjiang Zhongtai Chemical
Manufactures and sells chemicals in the People’s Republic of China.
Fair value with imperfect balance sheet.
Market Insights

Community Narratives


