
Advertisement
Ningxia Yinglite Chemicals Co., Ltd (SZSE:000635) Looks Inexpensive After Falling 26% But Perhaps Not Attractive Enough

Ningxia Yinglite Chemicals Co., Ltd (SZSE:000635) shareholders that were waiting for something to happen have been dealt a blow with a 26% share price drop in the last month. Instead of being rewarded, shareholders who have already held through the last twelve months are now sitting on a 30% share price drop.
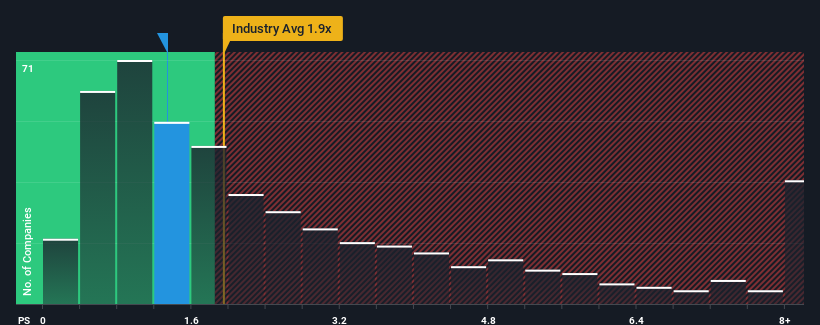
Following the heavy fall in price, Ningxia Yinglite Chemicals may be sending bullish signals at the moment with its price-to-sales (or "P/S") ratio of 1.3x, since almost half of all companies in the Chemicals industry in China have P/S ratios greater than 1.9x and even P/S higher than 4x are not unusual. Nonetheless, we'd need to dig a little deeper to determine if there is a rational basis for the reduced P/S.
See our latest analysis for Ningxia Yinglite Chemicals
What Does Ningxia Yinglite Chemicals' P/S Mean For Shareholders?
For example, consider that Ningxia Yinglite Chemicals' financial performance has been poor lately as its revenue has been in decline. Perhaps the market believes the recent revenue performance isn't good enough to keep up the industry, causing the P/S ratio to suffer. However, if this doesn't eventuate then existing shareholders may be feeling optimistic about the future direction of the share price.
Want the full picture on earnings, revenue and cash flow for the company? Then our free report on Ningxia Yinglite Chemicals will help you shine a light on its historical performance.Is There Any Revenue Growth Forecasted For Ningxia Yinglite Chemicals?
Ningxia Yinglite Chemicals' P/S ratio would be typical for a company that's only expected to deliver limited growth, and importantly, perform worse than the industry.
Retrospectively, the last year delivered a frustrating 16% decrease to the company's top line. This means it has also seen a slide in revenue over the longer-term as revenue is down 15% in total over the last three years. Therefore, it's fair to say the revenue growth recently has been undesirable for the company.
Weighing that medium-term revenue trajectory against the broader industry's one-year forecast for expansion of 25% shows it's an unpleasant look.
With this information, we are not surprised that Ningxia Yinglite Chemicals is trading at a P/S lower than the industry. However, we think shrinking revenues are unlikely to lead to a stable P/S over the longer term, which could set up shareholders for future disappointment. There's potential for the P/S to fall to even lower levels if the company doesn't improve its top-line growth.
The Bottom Line On Ningxia Yinglite Chemicals' P/S
Ningxia Yinglite Chemicals' P/S has taken a dip along with its share price. We'd say the price-to-sales ratio's power isn't primarily as a valuation instrument but rather to gauge current investor sentiment and future expectations.
It's no surprise that Ningxia Yinglite Chemicals maintains its low P/S off the back of its sliding revenue over the medium-term. At this stage investors feel the potential for an improvement in revenue isn't great enough to justify a higher P/S ratio. Unless the recent medium-term conditions improve, they will continue to form a barrier for the share price around these levels.
Before you settle on your opinion, we've discovered 3 warning signs for Ningxia Yinglite Chemicals that you should be aware of.
Of course, profitable companies with a history of great earnings growth are generally safer bets. So you may wish to see this free collection of other companies that have reasonable P/E ratios and have grown earnings strongly.
Valuation is complex, but we're here to simplify it.
Discover if Ningxia Yinglite Chemicals might be undervalued or overvalued with our detailed analysis, featuring fair value estimates, potential risks, dividends, insider trades, and its financial condition.
Access Free AnalysisHave feedback on this article? Concerned about the content? Get in touch with us directly. Alternatively, email editorial-team (at) simplywallst.com.
This article by Simply Wall St is general in nature. We provide commentary based on historical data and analyst forecasts only using an unbiased methodology and our articles are not intended to be financial advice. It does not constitute a recommendation to buy or sell any stock, and does not take account of your objectives, or your financial situation. We aim to bring you long-term focused analysis driven by fundamental data. Note that our analysis may not factor in the latest price-sensitive company announcements or qualitative material. Simply Wall St has no position in any stocks mentioned.
About SZSE:000635
Slightly overvalued very low.
Market Insights

Advertisement
Community Narratives

Apple: A Dying Star with an Overpriced Valuation
Fair Value US$177.34|17.7% overvalued
IN
Community Contributor
Avino a case for USD$20 per share within 5 years (assuming $3,500 gold, $100 silver and $4 copper).
Fair Value CA$26.79|86.0% undervalued
AG
Community Contributor
Riding the Defense Boom RENK Sees Revenue Climb at 15% CAGR by FY 2029
Fair Value €69.87|11.0% undervalued
CH
Community Contributor