Here's What's Concerning About North Huajin Chemical IndustriesLtd's (SZSE:000059) Returns On Capital


To avoid investing in a business that's in decline, there's a few financial metrics that can provide early indications of aging. A business that's potentially in decline often shows two trends, a return on capital employed (ROCE) that's declining, and a base of capital employed that's also declining. Ultimately this means that the company is earning less per dollar invested and on top of that, it's shrinking its base of capital employed. On that note, looking into North Huajin Chemical IndustriesLtd (SZSE:000059), we weren't too upbeat about how things were going.
What Is Return On Capital Employed (ROCE)?
Just to clarify if you're unsure, ROCE is a metric for evaluating how much pre-tax income (in percentage terms) a company earns on the capital invested in its business. The formula for this calculation on North Huajin Chemical IndustriesLtd is:
Return on Capital Employed = Earnings Before Interest and Tax (EBIT) ÷ (Total Assets - Current Liabilities)
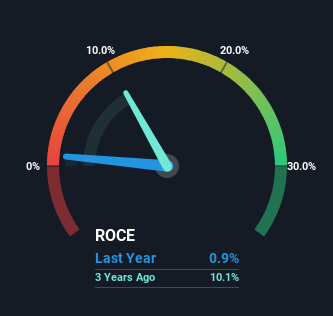
0.009 = CN¥224m ÷ (CN¥28b - CN¥3.1b) (Based on the trailing twelve months to March 2024).
Thus, North Huajin Chemical IndustriesLtd has an ROCE of 0.9%. In absolute terms, that's a low return and it also under-performs the Chemicals industry average of 5.5%.
View our latest analysis for North Huajin Chemical IndustriesLtd
In the above chart we have measured North Huajin Chemical IndustriesLtd's prior ROCE against its prior performance, but the future is arguably more important. If you'd like to see what analysts are forecasting going forward, you should check out our free analyst report for North Huajin Chemical IndustriesLtd .
The Trend Of ROCE
We are a bit worried about the trend of returns on capital at North Huajin Chemical IndustriesLtd. About five years ago, returns on capital were 9.3%, however they're now substantially lower than that as we saw above. On top of that, it's worth noting that the amount of capital employed within the business has remained relatively steady. Companies that exhibit these attributes tend to not be shrinking, but they can be mature and facing pressure on their margins from competition. If these trends continue, we wouldn't expect North Huajin Chemical IndustriesLtd to turn into a multi-bagger.
On a related note, North Huajin Chemical IndustriesLtd has decreased its current liabilities to 11% of total assets. So we could link some of this to the decrease in ROCE. What's more, this can reduce some aspects of risk to the business because now the company's suppliers or short-term creditors are funding less of its operations. Some would claim this reduces the business' efficiency at generating ROCE since it is now funding more of the operations with its own money.
In Conclusion...
All in all, the lower returns from the same amount of capital employed aren't exactly signs of a compounding machine. Long term shareholders who've owned the stock over the last five years have experienced a 11% depreciation in their investment, so it appears the market might not like these trends either. Unless there is a shift to a more positive trajectory in these metrics, we would look elsewhere.
One more thing: We've identified 2 warning signs with North Huajin Chemical IndustriesLtd (at least 1 which doesn't sit too well with us) , and understanding these would certainly be useful.
For those who like to invest in solid companies, check out this free list of companies with solid balance sheets and high returns on equity.
Valuation is complex, but we're here to simplify it.
Discover if North Huajin Chemical IndustriesLtd might be undervalued or overvalued with our detailed analysis, featuring fair value estimates, potential risks, dividends, insider trades, and its financial condition.
Access Free AnalysisHave feedback on this article? Concerned about the content? Get in touch with us directly. Alternatively, email editorial-team (at) simplywallst.com.
This article by Simply Wall St is general in nature. We provide commentary based on historical data and analyst forecasts only using an unbiased methodology and our articles are not intended to be financial advice. It does not constitute a recommendation to buy or sell any stock, and does not take account of your objectives, or your financial situation. We aim to bring you long-term focused analysis driven by fundamental data. Note that our analysis may not factor in the latest price-sensitive company announcements or qualitative material. Simply Wall St has no position in any stocks mentioned.
About SZSE:000059
North Huajin Chemical IndustriesLtd
Engages in the production and sales of petrochemicals and chemical fertilizers.
Fair value with moderate growth potential.
Market Insights

Community Narratives


