There Are Reasons To Feel Uneasy About Polyrocks ChemicalLTD's (SHSE:688669) Returns On Capital

What are the early trends we should look for to identify a stock that could multiply in value over the long term? One common approach is to try and find a company with returns on capital employed (ROCE) that are increasing, in conjunction with a growing amount of capital employed. Ultimately, this demonstrates that it's a business that is reinvesting profits at increasing rates of return. However, after briefly looking over the numbers, we don't think Polyrocks ChemicalLTD (SHSE:688669) has the makings of a multi-bagger going forward, but let's have a look at why that may be.
What Is Return On Capital Employed (ROCE)?
Just to clarify if you're unsure, ROCE is a metric for evaluating how much pre-tax income (in percentage terms) a company earns on the capital invested in its business. To calculate this metric for Polyrocks ChemicalLTD, this is the formula:
Return on Capital Employed = Earnings Before Interest and Tax (EBIT) ÷ (Total Assets - Current Liabilities)
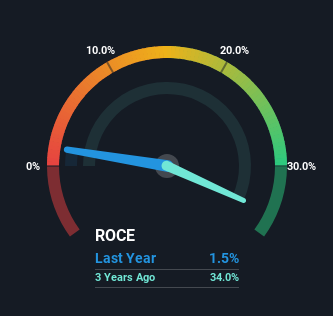
0.015 = CN¥40m ÷ (CN¥4.7b - CN¥2.2b) (Based on the trailing twelve months to December 2023).
Thus, Polyrocks ChemicalLTD has an ROCE of 1.5%. Ultimately, that's a low return and it under-performs the Chemicals industry average of 6.0%.
See our latest analysis for Polyrocks ChemicalLTD
While the past is not representative of the future, it can be helpful to know how a company has performed historically, which is why we have this chart above. If you'd like to look at how Polyrocks ChemicalLTD has performed in the past in other metrics, you can view this free graph of Polyrocks ChemicalLTD's past earnings, revenue and cash flow.
So How Is Polyrocks ChemicalLTD's ROCE Trending?
We weren't thrilled with the trend because Polyrocks ChemicalLTD's ROCE has reduced by 87% over the last five years, while the business employed 473% more capital. That being said, Polyrocks ChemicalLTD raised some capital prior to their latest results being released, so that could partly explain the increase in capital employed. The funds raised likely haven't been put to work yet so it's worth watching what happens in the future with Polyrocks ChemicalLTD's earnings and if they change as a result from the capital raise.
On a separate but related note, it's important to know that Polyrocks ChemicalLTD has a current liabilities to total assets ratio of 46%, which we'd consider pretty high. This effectively means that suppliers (or short-term creditors) are funding a large portion of the business, so just be aware that this can introduce some elements of risk. While it's not necessarily a bad thing, it can be beneficial if this ratio is lower.
The Bottom Line On Polyrocks ChemicalLTD's ROCE
In summary, Polyrocks ChemicalLTD is reinvesting funds back into the business for growth but unfortunately it looks like sales haven't increased much just yet. Since the stock has declined 63% over the last three years, investors may not be too optimistic on this trend improving either. In any case, the stock doesn't have these traits of a multi-bagger discussed above, so if that's what you're looking for, we think you'd have more luck elsewhere.
Polyrocks ChemicalLTD does come with some risks though, we found 3 warning signs in our investment analysis, and 1 of those is a bit concerning...
While Polyrocks ChemicalLTD isn't earning the highest return, check out this free list of companies that are earning high returns on equity with solid balance sheets.
Mobile Infrastructure for Defense and Disaster
The next wave in robotics isn't humanoid. Its fully autonomous towers delivering 5G, ISR, and radar in under 30 minutes, anywhere.
Get the investor briefing before the next round of contracts
Sponsored On Behalf of CiTechNew: Manage All Your Stock Portfolios in One Place
We've created the ultimate portfolio companion for stock investors, and it's free.
• Connect an unlimited number of Portfolios and see your total in one currency
• Be alerted to new Warning Signs or Risks via email or mobile
• Track the Fair Value of your stocks
Have feedback on this article? Concerned about the content? Get in touch with us directly. Alternatively, email editorial-team (at) simplywallst.com.
This article by Simply Wall St is general in nature. We provide commentary based on historical data and analyst forecasts only using an unbiased methodology and our articles are not intended to be financial advice. It does not constitute a recommendation to buy or sell any stock, and does not take account of your objectives, or your financial situation. We aim to bring you long-term focused analysis driven by fundamental data. Note that our analysis may not factor in the latest price-sensitive company announcements or qualitative material. Simply Wall St has no position in any stocks mentioned.
About SHSE:688669
Polyrocks ChemicalLTD
Researches, produces, and distributes environmental halogen-free flame retardant plastics in China and internationally.
Slightly overvalued with very low risk.
Market Insights

Weekly Picks

THE KINGDOM OF BROWN GOODS: WHY MGPI IS BEING CRUSHED BY INVENTORY & PRIMED FOR RESURRECTION


Why Vertical Aerospace (NYSE: EVTL) is Worth Possibly Over 13x its Current Price


The Quiet Giant That Became AI’s Power Grid
Recently Updated Narratives


A tech powerhouse quietly powering the world’s AI infrastructure.


Keppel DC REIT (SGX: AJBU) is a resilient gem in the data center space.
Why Vertical Aerospace (NYSE: EVTL) is Worth Possibly Over 13x its Current Price
Popular Narratives

MicroVision will explode future revenue by 380.37% with a vision towards success


Crazy Undervalued 42 Baggers Silver Play (Active & Running Mine)


