Investors Appear Satisfied With Zhejiang Sanmei Chemical Industry Co.,Ltd.'s (SHSE:603379) Prospects As Shares Rocket 36%


Zhejiang Sanmei Chemical Industry Co.,Ltd. (SHSE:603379) shareholders are no doubt pleased to see that the share price has bounced 36% in the last month, although it is still struggling to make up recently lost ground. Looking further back, the 23% rise over the last twelve months isn't too bad notwithstanding the strength over the last 30 days.
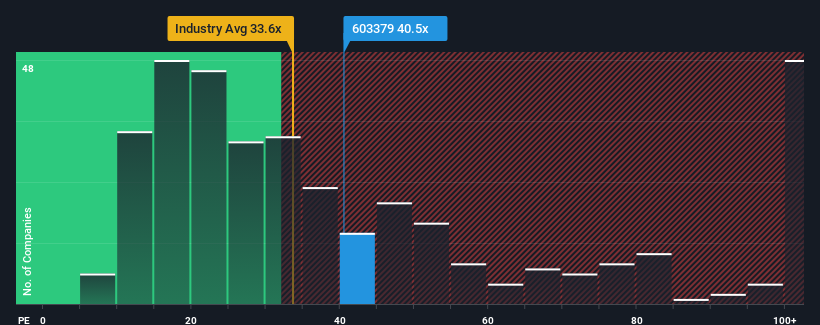
After such a large jump in price, Zhejiang Sanmei Chemical IndustryLtd may be sending bearish signals at the moment with its price-to-earnings (or "P/E") ratio of 40.5x, since almost half of all companies in China have P/E ratios under 33x and even P/E's lower than 20x are not unusual. Although, it's not wise to just take the P/E at face value as there may be an explanation why it's as high as it is.
Zhejiang Sanmei Chemical IndustryLtd certainly has been doing a good job lately as its earnings growth has been positive while most other companies have been seeing their earnings go backwards. It seems that many are expecting the company to continue defying the broader market adversity, which has increased investors’ willingness to pay up for the stock. You'd really hope so, otherwise you're paying a pretty hefty price for no particular reason.
View our latest analysis for Zhejiang Sanmei Chemical IndustryLtd
What Are Growth Metrics Telling Us About The High P/E?
The only time you'd be truly comfortable seeing a P/E as high as Zhejiang Sanmei Chemical IndustryLtd's is when the company's growth is on track to outshine the market.
Retrospectively, the last year delivered an exceptional 100% gain to the company's bottom line. Pleasingly, EPS has also lifted 182% in aggregate from three years ago, thanks to the last 12 months of growth. Therefore, it's fair to say the earnings growth recently has been superb for the company.
Turning to the outlook, the next three years should generate growth of 29% per annum as estimated by the four analysts watching the company. Meanwhile, the rest of the market is forecast to only expand by 19% per annum, which is noticeably less attractive.
With this information, we can see why Zhejiang Sanmei Chemical IndustryLtd is trading at such a high P/E compared to the market. It seems most investors are expecting this strong future growth and are willing to pay more for the stock.
The Key Takeaway
Zhejiang Sanmei Chemical IndustryLtd's P/E is getting right up there since its shares have risen strongly. It's argued the price-to-earnings ratio is an inferior measure of value within certain industries, but it can be a powerful business sentiment indicator.
As we suspected, our examination of Zhejiang Sanmei Chemical IndustryLtd's analyst forecasts revealed that its superior earnings outlook is contributing to its high P/E. Right now shareholders are comfortable with the P/E as they are quite confident future earnings aren't under threat. Unless these conditions change, they will continue to provide strong support to the share price.
Don't forget that there may be other risks. For instance, we've identified 2 warning signs for Zhejiang Sanmei Chemical IndustryLtd (1 is potentially serious) you should be aware of.
You might be able to find a better investment than Zhejiang Sanmei Chemical IndustryLtd. If you want a selection of possible candidates, check out this free list of interesting companies that trade on a low P/E (but have proven they can grow earnings).
Valuation is complex, but we're here to simplify it.
Discover if Zhejiang Sanmei Chemical IndustryLtd might be undervalued or overvalued with our detailed analysis, featuring fair value estimates, potential risks, dividends, insider trades, and its financial condition.
Access Free AnalysisHave feedback on this article? Concerned about the content? Get in touch with us directly. Alternatively, email editorial-team (at) simplywallst.com.
This article by Simply Wall St is general in nature. We provide commentary based on historical data and analyst forecasts only using an unbiased methodology and our articles are not intended to be financial advice. It does not constitute a recommendation to buy or sell any stock, and does not take account of your objectives, or your financial situation. We aim to bring you long-term focused analysis driven by fundamental data. Note that our analysis may not factor in the latest price-sensitive company announcements or qualitative material. Simply Wall St has no position in any stocks mentioned.
About SHSE:603379
Zhejiang Sanmei Chemical IndustryLtd
Zhejiang Sanmei Chemical Industry Co., Ltd.
Excellent balance sheet and good value.
Similar Companies
Market Insights

Community Narratives


