
Advertisement
- China
- /
- Metals and Mining
- /
- SHSE:603327
What You Can Learn From Sichuan Furong Technology Co., Ltd.'s (SHSE:603327) P/EAfter Its 28% Share Price Crash
The Sichuan Furong Technology Co., Ltd. (SHSE:603327) share price has softened a substantial 28% over the previous 30 days, handing back much of the gains the stock has made lately. Still, a bad month hasn't completely ruined the past year with the stock gaining 32%, which is great even in a bull market.
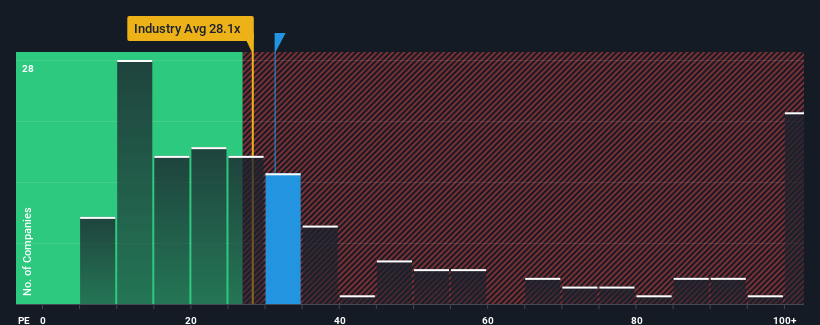
Although its price has dipped substantially, it's still not a stretch to say that Sichuan Furong Technology's price-to-earnings (or "P/E") ratio of 31.2x right now seems quite "middle-of-the-road" compared to the market in China, where the median P/E ratio is around 29x. Although, it's not wise to simply ignore the P/E without explanation as investors may be disregarding a distinct opportunity or a costly mistake.
Sichuan Furong Technology hasn't been tracking well recently as its declining earnings compare poorly to other companies, which have seen some growth on average. One possibility is that the P/E is moderate because investors think this poor earnings performance will turn around. You'd really hope so, otherwise you're paying a relatively elevated price for a company with this sort of growth profile.
View our latest analysis for Sichuan Furong Technology
Does Growth Match The P/E?
There's an inherent assumption that a company should be matching the market for P/E ratios like Sichuan Furong Technology's to be considered reasonable.
Taking a look back first, the company's earnings per share growth last year wasn't something to get excited about as it posted a disappointing decline of 23%. Unfortunately, that's brought it right back to where it started three years ago with EPS growth being virtually non-existent overall during that time. Accordingly, shareholders probably wouldn't have been overly satisfied with the unstable medium-term growth rates.
Turning to the outlook, the next year should generate growth of 32% as estimated by the dual analysts watching the company. That's shaping up to be similar to the 35% growth forecast for the broader market.
In light of this, it's understandable that Sichuan Furong Technology's P/E sits in line with the majority of other companies. It seems most investors are expecting to see average future growth and are only willing to pay a moderate amount for the stock.
What We Can Learn From Sichuan Furong Technology's P/E?
With its share price falling into a hole, the P/E for Sichuan Furong Technology looks quite average now. Typically, we'd caution against reading too much into price-to-earnings ratios when settling on investment decisions, though it can reveal plenty about what other market participants think about the company.
As we suspected, our examination of Sichuan Furong Technology's analyst forecasts revealed that its market-matching earnings outlook is contributing to its current P/E. Right now shareholders are comfortable with the P/E as they are quite confident future earnings won't throw up any surprises. It's hard to see the share price moving strongly in either direction in the near future under these circumstances.
Before you settle on your opinion, we've discovered 3 warning signs for Sichuan Furong Technology (2 can't be ignored!) that you should be aware of.
It's important to make sure you look for a great company, not just the first idea you come across. So take a peek at this free list of interesting companies with strong recent earnings growth (and a low P/E).
New: Manage All Your Stock Portfolios in One Place
We've created the ultimate portfolio companion for stock investors, and it's free.
• Connect an unlimited number of Portfolios and see your total in one currency
• Be alerted to new Warning Signs or Risks via email or mobile
• Track the Fair Value of your stocks
Have feedback on this article? Concerned about the content? Get in touch with us directly. Alternatively, email editorial-team (at) simplywallst.com.
This article by Simply Wall St is general in nature. We provide commentary based on historical data and analyst forecasts only using an unbiased methodology and our articles are not intended to be financial advice. It does not constitute a recommendation to buy or sell any stock, and does not take account of your objectives, or your financial situation. We aim to bring you long-term focused analysis driven by fundamental data. Note that our analysis may not factor in the latest price-sensitive company announcements or qualitative material. Simply Wall St has no position in any stocks mentioned.
About SHSE:603327
Sichuan Furong Technology
Engages in the research, development, production, and sale of aluminum structural parts for consumer electronics products.
Adequate balance sheet with low risk.
Market Insights

Advertisement
Community Narratives
MicroVision will explode future revenue by 380.37% with a vision towards success
Fair Value US$60|98.4% undervalued
TH
Community Contributor
The Indispensable Artery for a New North American Economy
Fair Value CA$132.87|0.7% overvalued
TI
Community Contributor
Recently Updated Narratives
CO

composite32 on Astor Enerji ·
Astor Enerji will surge with a fair value of $140.43 in the next 3 years
Fair Value:₺140.4335.5% undervalued
1 followerusers have followed this narrative
0 commentsusers have commented on this narrative
0 likesusers have liked this narrative
RE

RecMag on Proximus ·
Proximus: The State-Backed Backup Plan with 7% Gross Yield and 15% Currency Upside.
Fair Value:€17.1356.7% undervalued
29 followersusers have followed this narrative
0 commentsusers have commented on this narrative
0 likesusers have liked this narrative
AG


Agricola on IMPACT Silver ·
A case for for IMPACT Silver Corp (TSXV:IPT) to reach USD $4.52 (CAD $6.16) in 2026 (23 bagger in 1 year) and USD $5.76 (CAD $7.89) by 2030
Fair Value:CA$7.8996.2% undervalued
1 followerusers have followed this narrative
0 commentsusers have commented on this narrative
0 likesusers have liked this narrative
Popular Narratives
TH

TheWallstreetKing on MicroVision ·
MicroVision will explode future revenue by 380.37% with a vision towards success
Fair Value:US$6098.4% undervalued
101 followersusers have followed this narrative
10 commentsusers have commented on this narrative
20 likesusers have liked this narrative
OS


oscargarcia on Alphabet ·
The company that turned a verb into a global necessity and basically runs the modern internet, digital ads, smartphones, maps, and AI.
Fair Value:US$3405.8% undervalued
137 followersusers have followed this narrative
6 commentsusers have commented on this narrative
18 likesusers have liked this narrative
AN


AnalystConsensusTarget on NVIDIA ·
NVDA: Expanding AI Demand Will Drive Major Data Center Investments Through 2026
Fair Value:US$232.7924.0% undervalued
929 followersusers have followed this narrative
6 commentsusers have commented on this narrative
22 likesusers have liked this narrative