What Guizhou Zhongyida Co., Ltd's (SHSE:600610) 27% Share Price Gain Is Not Telling You


Guizhou Zhongyida Co., Ltd (SHSE:600610) shareholders would be excited to see that the share price has had a great month, posting a 27% gain and recovering from prior weakness. But the last month did very little to improve the 50% share price decline over the last year.
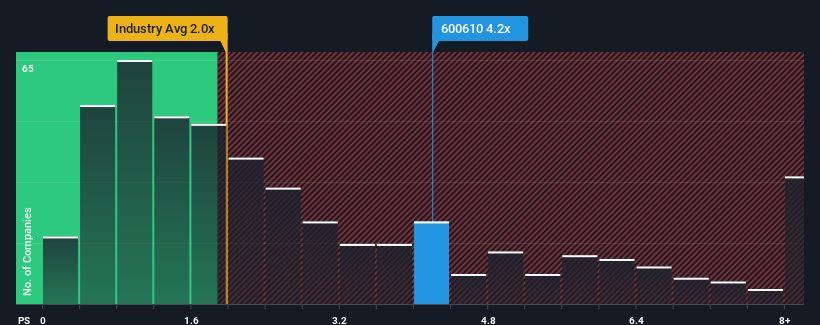
Following the firm bounce in price, you could be forgiven for thinking Guizhou Zhongyida is a stock to steer clear of with a price-to-sales ratios (or "P/S") of 4.2x, considering almost half the companies in China's Chemicals industry have P/S ratios below 2x. Nonetheless, we'd need to dig a little deeper to determine if there is a rational basis for the highly elevated P/S.
See our latest analysis for Guizhou Zhongyida
How Has Guizhou Zhongyida Performed Recently?
For instance, Guizhou Zhongyida's receding revenue in recent times would have to be some food for thought. It might be that many expect the company to still outplay most other companies over the coming period, which has kept the P/S from collapsing. If not, then existing shareholders may be quite nervous about the viability of the share price.
Want the full picture on earnings, revenue and cash flow for the company? Then our free report on Guizhou Zhongyida will help you shine a light on its historical performance.How Is Guizhou Zhongyida's Revenue Growth Trending?
Guizhou Zhongyida's P/S ratio would be typical for a company that's expected to deliver very strong growth, and importantly, perform much better than the industry.
In reviewing the last year of financials, we were disheartened to see the company's revenues fell to the tune of 5.5%. As a result, revenue from three years ago have also fallen 6.5% overall. So unfortunately, we have to acknowledge that the company has not done a great job of growing revenue over that time.
Weighing that medium-term revenue trajectory against the broader industry's one-year forecast for expansion of 23% shows it's an unpleasant look.
With this in mind, we find it worrying that Guizhou Zhongyida's P/S exceeds that of its industry peers. It seems most investors are ignoring the recent poor growth rate and are hoping for a turnaround in the company's business prospects. There's a very good chance existing shareholders are setting themselves up for future disappointment if the P/S falls to levels more in line with the recent negative growth rates.
What Does Guizhou Zhongyida's P/S Mean For Investors?
The strong share price surge has lead to Guizhou Zhongyida's P/S soaring as well. Using the price-to-sales ratio alone to determine if you should sell your stock isn't sensible, however it can be a practical guide to the company's future prospects.
Our examination of Guizhou Zhongyida revealed its shrinking revenue over the medium-term isn't resulting in a P/S as low as we expected, given the industry is set to grow. When we see revenue heading backwards and underperforming the industry forecasts, we feel the possibility of the share price declining is very real, bringing the P/S back into the realm of reasonability. Unless the the circumstances surrounding the recent medium-term improve, it wouldn't be wrong to expect a a difficult period ahead for the company's shareholders.
A lot of potential risks can sit within a company's balance sheet. Our free balance sheet analysis for Guizhou Zhongyida with six simple checks will allow you to discover any risks that could be an issue.
It's important to make sure you look for a great company, not just the first idea you come across. So if growing profitability aligns with your idea of a great company, take a peek at this free list of interesting companies with strong recent earnings growth (and a low P/E).
New: Manage All Your Stock Portfolios in One Place
We've created the ultimate portfolio companion for stock investors, and it's free.
• Connect an unlimited number of Portfolios and see your total in one currency
• Be alerted to new Warning Signs or Risks via email or mobile
• Track the Fair Value of your stocks
Have feedback on this article? Concerned about the content? Get in touch with us directly. Alternatively, email editorial-team (at) simplywallst.com.
This article by Simply Wall St is general in nature. We provide commentary based on historical data and analyst forecasts only using an unbiased methodology and our articles are not intended to be financial advice. It does not constitute a recommendation to buy or sell any stock, and does not take account of your objectives, or your financial situation. We aim to bring you long-term focused analysis driven by fundamental data. Note that our analysis may not factor in the latest price-sensitive company announcements or qualitative material. Simply Wall St has no position in any stocks mentioned.
About SHSE:600610
Guizhou Zhongyida
Produces and sells fine chemical products in the People’s Republic of China.
Adequate balance sheet and slightly overvalued.
Market Insights

Community Narratives


