- China
- /
- Paper and Forestry Products
- /
- SHSE:600567
There Are Reasons To Feel Uneasy About Shanying International HoldingsLtd's (SHSE:600567) Returns On Capital


If we want to find a stock that could multiply over the long term, what are the underlying trends we should look for? Typically, we'll want to notice a trend of growing return on capital employed (ROCE) and alongside that, an expanding base of capital employed. Put simply, these types of businesses are compounding machines, meaning they are continually reinvesting their earnings at ever-higher rates of return. In light of that, when we looked at Shanying International HoldingsLtd (SHSE:600567) and its ROCE trend, we weren't exactly thrilled.
Return On Capital Employed (ROCE): What Is It?
For those who don't know, ROCE is a measure of a company's yearly pre-tax profit (its return), relative to the capital employed in the business. To calculate this metric for Shanying International HoldingsLtd, this is the formula:
Return on Capital Employed = Earnings Before Interest and Tax (EBIT) ÷ (Total Assets - Current Liabilities)
0.034 = CN¥901m ÷ (CN¥55b - CN¥29b) (Based on the trailing twelve months to June 2024).
So, Shanying International HoldingsLtd has an ROCE of 3.4%. Ultimately, that's a low return and it under-performs the Forestry industry average of 6.2%.
See our latest analysis for Shanying International HoldingsLtd
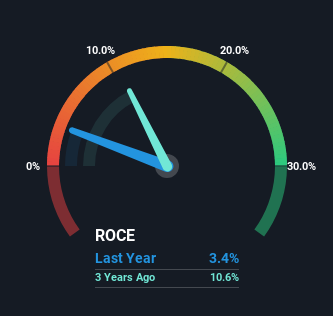
Above you can see how the current ROCE for Shanying International HoldingsLtd compares to its prior returns on capital, but there's only so much you can tell from the past. If you'd like to see what analysts are forecasting going forward, you should check out our free analyst report for Shanying International HoldingsLtd .
What Can We Tell From Shanying International HoldingsLtd's ROCE Trend?
When we looked at the ROCE trend at Shanying International HoldingsLtd, we didn't gain much confidence. Over the last five years, returns on capital have decreased to 3.4% from 13% five years ago. However it looks like Shanying International HoldingsLtd might be reinvesting for long term growth because while capital employed has increased, the company's sales haven't changed much in the last 12 months. It may take some time before the company starts to see any change in earnings from these investments.
On a side note, Shanying International HoldingsLtd's current liabilities are still rather high at 52% of total assets. This can bring about some risks because the company is basically operating with a rather large reliance on its suppliers or other sorts of short-term creditors. Ideally we'd like to see this reduce as that would mean fewer obligations bearing risks.
The Key Takeaway
In summary, Shanying International HoldingsLtd is reinvesting funds back into the business for growth but unfortunately it looks like sales haven't increased much just yet. And investors appear hesitant that the trends will pick up because the stock has fallen 40% in the last five years. All in all, the inherent trends aren't typical of multi-baggers, so if that's what you're after, we think you might have more luck elsewhere.
Shanying International HoldingsLtd does have some risks, we noticed 4 warning signs (and 1 which is a bit unpleasant) we think you should know about.
While Shanying International HoldingsLtd isn't earning the highest return, check out this free list of companies that are earning high returns on equity with solid balance sheets.
If you're looking to trade Shanying International HoldingsLtd, open an account with the lowest-cost platform trusted by professionals, Interactive Brokers.
With clients in over 200 countries and territories, and access to 160 markets, IBKR lets you trade stocks, options, futures, forex, bonds and funds from a single integrated account.
Enjoy no hidden fees, no account minimums, and FX conversion rates as low as 0.03%, far better than what most brokers offer.
Sponsored ContentNew: Manage All Your Stock Portfolios in One Place
We've created the ultimate portfolio companion for stock investors, and it's free.
• Connect an unlimited number of Portfolios and see your total in one currency
• Be alerted to new Warning Signs or Risks via email or mobile
• Track the Fair Value of your stocks
Have feedback on this article? Concerned about the content? Get in touch with us directly. Alternatively, email editorial-team (at) simplywallst.com.
This article by Simply Wall St is general in nature. We provide commentary based on historical data and analyst forecasts only using an unbiased methodology and our articles are not intended to be financial advice. It does not constitute a recommendation to buy or sell any stock, and does not take account of your objectives, or your financial situation. We aim to bring you long-term focused analysis driven by fundamental data. Note that our analysis may not factor in the latest price-sensitive company announcements or qualitative material. Simply Wall St has no position in any stocks mentioned.
About SHSE:600567
Shanying International HoldingsLtd
Engages in regenerated fiber, papermaking, packaging, and printing businesses.
Undervalued with moderate growth potential.
Market Insights

Community Narratives


