
Advertisement
- China
- /
- Metals and Mining
- /
- SHSE:600281
Shanxi Huayang New Material Co.,Ltd.'s (SHSE:600281) 27% Dip Still Leaving Some Shareholders Feeling Restless Over Its P/SRatio

The Shanxi Huayang New Material Co.,Ltd. (SHSE:600281) share price has fared very poorly over the last month, falling by a substantial 27%. Instead of being rewarded, shareholders who have already held through the last twelve months are now sitting on a 33% share price drop.
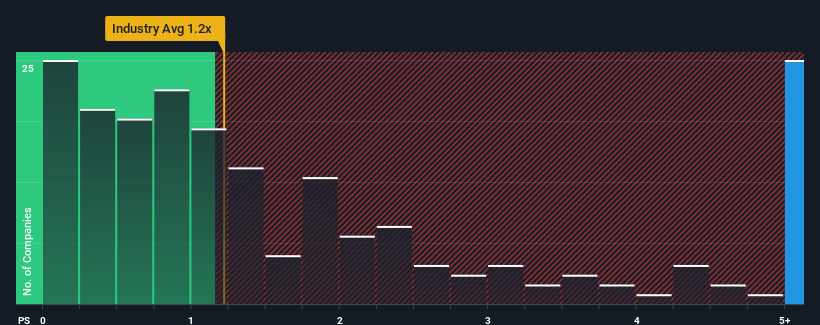
Although its price has dipped substantially, when almost half of the companies in China's Metals and Mining industry have price-to-sales ratios (or "P/S") below 1.2x, you may still consider Shanxi Huayang New MaterialLtd as a stock not worth researching with its 6.4x P/S ratio. Nonetheless, we'd need to dig a little deeper to determine if there is a rational basis for the highly elevated P/S.
See our latest analysis for Shanxi Huayang New MaterialLtd
What Does Shanxi Huayang New MaterialLtd's P/S Mean For Shareholders?
As an illustration, revenue has deteriorated at Shanxi Huayang New MaterialLtd over the last year, which is not ideal at all. It might be that many expect the company to still outplay most other companies over the coming period, which has kept the P/S from collapsing. You'd really hope so, otherwise you're paying a pretty hefty price for no particular reason.
Want the full picture on earnings, revenue and cash flow for the company? Then our free report on Shanxi Huayang New MaterialLtd will help you shine a light on its historical performance.What Are Revenue Growth Metrics Telling Us About The High P/S?
In order to justify its P/S ratio, Shanxi Huayang New MaterialLtd would need to produce outstanding growth that's well in excess of the industry.
Retrospectively, the last year delivered a frustrating 28% decrease to the company's top line. The last three years don't look nice either as the company has shrunk revenue by 54% in aggregate. So unfortunately, we have to acknowledge that the company has not done a great job of growing revenue over that time.
In contrast to the company, the rest of the industry is expected to grow by 15% over the next year, which really puts the company's recent medium-term revenue decline into perspective.
With this information, we find it concerning that Shanxi Huayang New MaterialLtd is trading at a P/S higher than the industry. It seems most investors are ignoring the recent poor growth rate and are hoping for a turnaround in the company's business prospects. There's a very good chance existing shareholders are setting themselves up for future disappointment if the P/S falls to levels more in line with the recent negative growth rates.
The Bottom Line On Shanxi Huayang New MaterialLtd's P/S
Even after such a strong price drop, Shanxi Huayang New MaterialLtd's P/S still exceeds the industry median significantly. Generally, our preference is to limit the use of the price-to-sales ratio to establishing what the market thinks about the overall health of a company.
Our examination of Shanxi Huayang New MaterialLtd revealed its shrinking revenue over the medium-term isn't resulting in a P/S as low as we expected, given the industry is set to grow. When we see revenue heading backwards and underperforming the industry forecasts, we feel the possibility of the share price declining is very real, bringing the P/S back into the realm of reasonability. Unless the the circumstances surrounding the recent medium-term improve, it wouldn't be wrong to expect a a difficult period ahead for the company's shareholders.
We don't want to rain on the parade too much, but we did also find 2 warning signs for Shanxi Huayang New MaterialLtd that you need to be mindful of.
If companies with solid past earnings growth is up your alley, you may wish to see this free collection of other companies with strong earnings growth and low P/E ratios.
New: Manage All Your Stock Portfolios in One Place
We've created the ultimate portfolio companion for stock investors, and it's free.
• Connect an unlimited number of Portfolios and see your total in one currency
• Be alerted to new Warning Signs or Risks via email or mobile
• Track the Fair Value of your stocks
Have feedback on this article? Concerned about the content? Get in touch with us directly. Alternatively, email editorial-team (at) simplywallst.com.
This article by Simply Wall St is general in nature. We provide commentary based on historical data and analyst forecasts only using an unbiased methodology and our articles are not intended to be financial advice. It does not constitute a recommendation to buy or sell any stock, and does not take account of your objectives, or your financial situation. We aim to bring you long-term focused analysis driven by fundamental data. Note that our analysis may not factor in the latest price-sensitive company announcements or qualitative material. Simply Wall St has no position in any stocks mentioned.
About SHSE:600281
Shanxi Huayang New MaterialLtd
Engages in the production and sale of precious metals, and biodegradable materials and products in China.
Low with worrying balance sheet.
Market Insights

Advertisement
Community Narratives
Scaling up in building materials with smart M&A and growing profitability
Fair Value US$2.77|29.6% undervalued
CM
Community Contributor
Hims: The Platform Powering Personalised Healthcare
Fair Value US$114.01|49.1% undervalued
BL
Community Contributor
Undervalued lottery company with strong fundamentals
Fair Value AU$15.00|35.8% undervalued
RO
Community Contributor
Proximus, transferring money from the impatient to the patient investor
Fair Value €16.62|55.2% undervalued
AX
Community Contributor