- China
- /
- Metals and Mining
- /
- SHSE:600281
Shanxi Huayang New Material Co.,Ltd. (SHSE:600281) Shares May Have Slumped 26% But Getting In Cheap Is Still Unlikely


Shanxi Huayang New Material Co.,Ltd. (SHSE:600281) shareholders that were waiting for something to happen have been dealt a blow with a 26% share price drop in the last month. The drop over the last 30 days has capped off a tough year for shareholders, with the share price down 32% in that time.
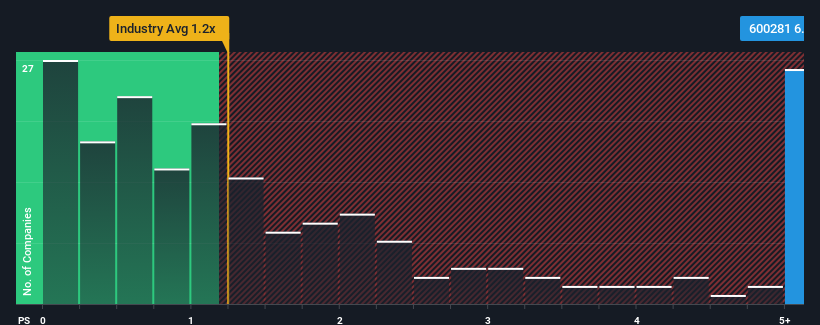
Although its price has dipped substantially, when almost half of the companies in China's Metals and Mining industry have price-to-sales ratios (or "P/S") below 1.2x, you may still consider Shanxi Huayang New MaterialLtd as a stock not worth researching with its 6x P/S ratio. Nonetheless, we'd need to dig a little deeper to determine if there is a rational basis for the highly elevated P/S.
Check out our latest analysis for Shanxi Huayang New MaterialLtd
What Does Shanxi Huayang New MaterialLtd's Recent Performance Look Like?
For example, consider that Shanxi Huayang New MaterialLtd's financial performance has been poor lately as its revenue has been in decline. It might be that many expect the company to still outplay most other companies over the coming period, which has kept the P/S from collapsing. You'd really hope so, otherwise you're paying a pretty hefty price for no particular reason.
Want the full picture on earnings, revenue and cash flow for the company? Then our free report on Shanxi Huayang New MaterialLtd will help you shine a light on its historical performance.Do Revenue Forecasts Match The High P/S Ratio?
Shanxi Huayang New MaterialLtd's P/S ratio would be typical for a company that's expected to deliver very strong growth, and importantly, perform much better than the industry.
In reviewing the last year of financials, we were disheartened to see the company's revenues fell to the tune of 29%. This means it has also seen a slide in revenue over the longer-term as revenue is down 13% in total over the last three years. So unfortunately, we have to acknowledge that the company has not done a great job of growing revenue over that time.
In contrast to the company, the rest of the industry is expected to grow by 15% over the next year, which really puts the company's recent medium-term revenue decline into perspective.
With this information, we find it concerning that Shanxi Huayang New MaterialLtd is trading at a P/S higher than the industry. Apparently many investors in the company are way more bullish than recent times would indicate and aren't willing to let go of their stock at any price. There's a very good chance existing shareholders are setting themselves up for future disappointment if the P/S falls to levels more in line with the recent negative growth rates.
The Final Word
Shanxi Huayang New MaterialLtd's shares may have suffered, but its P/S remains high. Generally, our preference is to limit the use of the price-to-sales ratio to establishing what the market thinks about the overall health of a company.
We've established that Shanxi Huayang New MaterialLtd currently trades on a much higher than expected P/S since its recent revenues have been in decline over the medium-term. Right now we aren't comfortable with the high P/S as this revenue performance is highly unlikely to support such positive sentiment for long. Should recent medium-term revenue trends persist, it would pose a significant risk to existing shareholders' investments and prospective investors will have a hard time accepting the current value of the stock.
Don't forget that there may be other risks. For instance, we've identified 3 warning signs for Shanxi Huayang New MaterialLtd that you should be aware of.
If companies with solid past earnings growth is up your alley, you may wish to see this free collection of other companies with strong earnings growth and low P/E ratios.
If you're looking to trade Shanxi Huayang New MaterialLtd, open an account with the lowest-cost platform trusted by professionals, Interactive Brokers.
With clients in over 200 countries and territories, and access to 160 markets, IBKR lets you trade stocks, options, futures, forex, bonds and funds from a single integrated account.
Enjoy no hidden fees, no account minimums, and FX conversion rates as low as 0.03%, far better than what most brokers offer.
Sponsored ContentNew: Manage All Your Stock Portfolios in One Place
We've created the ultimate portfolio companion for stock investors, and it's free.
• Connect an unlimited number of Portfolios and see your total in one currency
• Be alerted to new Warning Signs or Risks via email or mobile
• Track the Fair Value of your stocks
Have feedback on this article? Concerned about the content? Get in touch with us directly. Alternatively, email editorial-team (at) simplywallst.com.
This article by Simply Wall St is general in nature. We provide commentary based on historical data and analyst forecasts only using an unbiased methodology and our articles are not intended to be financial advice. It does not constitute a recommendation to buy or sell any stock, and does not take account of your objectives, or your financial situation. We aim to bring you long-term focused analysis driven by fundamental data. Note that our analysis may not factor in the latest price-sensitive company announcements or qualitative material. Simply Wall St has no position in any stocks mentioned.
Have feedback on this article? Concerned about the content? Get in touch with us directly. Alternatively, email editorial-team@simplywallst.com
About SHSE:600281
Shanxi Huayang New MaterialLtd
Engages in the production and sale of precious metals, and biodegradable materials and products in China.
Low with worrying balance sheet.
Market Insights

Community Narratives


