- China
- /
- Personal Products
- /
- SHSE:603605
Proya CosmeticsLtd (SHSE:603605) Strong Profits May Be Masking Some Underlying Issues


Proya Cosmetics Co.,Ltd. (SHSE:603605) just released a solid earnings report, and the stock displayed some strength. Despite this, our analysis suggests that there are some factors weakening the foundations of those good profit numbers.
View our latest analysis for Proya CosmeticsLtd
Zooming In On Proya CosmeticsLtd's Earnings
Many investors haven't heard of the accrual ratio from cashflow, but it is actually a useful measure of how well a company's profit is backed up by free cash flow (FCF) during a given period. In plain english, this ratio subtracts FCF from net profit, and divides that number by the company's average operating assets over that period. You could think of the accrual ratio from cashflow as the 'non-FCF profit ratio'.
As a result, a negative accrual ratio is a positive for the company, and a positive accrual ratio is a negative. While it's not a problem to have a positive accrual ratio, indicating a certain level of non-cash profits, a high accrual ratio is arguably a bad thing, because it indicates paper profits are not matched by cash flow. That's because some academic studies have suggested that high accruals ratios tend to lead to lower profit or less profit growth.
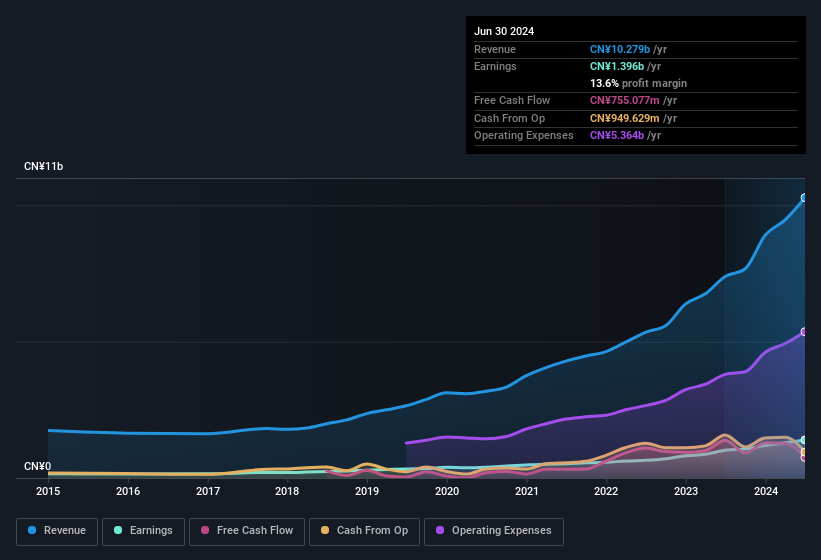
For the year to June 2024, Proya CosmeticsLtd had an accrual ratio of 0.54. Ergo, its free cash flow is significantly weaker than its profit. As a general rule, that bodes poorly for future profitability. In fact, it had free cash flow of CN¥755m in the last year, which was a lot less than its statutory profit of CN¥1.40b. Proya CosmeticsLtd's free cash flow actually declined over the last year, but it may bounce back next year, since free cash flow is often more volatile than accounting profits. The good news for shareholders is that Proya CosmeticsLtd's accrual ratio was much better last year, so this year's poor reading might simply be a case of a short term mismatch between profit and FCF. Shareholders should look for improved cashflow relative to profit in the current year, if that is indeed the case.
That might leave you wondering what analysts are forecasting in terms of future profitability. Luckily, you can click here to see an interactive graph depicting future profitability, based on their estimates.
Our Take On Proya CosmeticsLtd's Profit Performance
As we have made quite clear, we're a bit worried that Proya CosmeticsLtd didn't back up the last year's profit with free cashflow. For this reason, we think that Proya CosmeticsLtd's statutory profits may be a bad guide to its underlying earnings power, and might give investors an overly positive impression of the company. But on the bright side, its earnings per share have grown at an extremely impressive rate over the last three years. Of course, we've only just scratched the surface when it comes to analysing its earnings; one could also consider margins, forecast growth, and return on investment, among other factors. With this in mind, we wouldn't consider investing in a stock unless we had a thorough understanding of the risks. Case in point: We've spotted 1 warning sign for Proya CosmeticsLtd you should be aware of.
This note has only looked at a single factor that sheds light on the nature of Proya CosmeticsLtd's profit. But there are plenty of other ways to inform your opinion of a company. For example, many people consider a high return on equity as an indication of favorable business economics, while others like to 'follow the money' and search out stocks that insiders are buying. While it might take a little research on your behalf, you may find this free collection of companies boasting high return on equity, or this list of stocks with significant insider holdings to be useful.
New: Manage All Your Stock Portfolios in One Place
We've created the ultimate portfolio companion for stock investors, and it's free.
• Connect an unlimited number of Portfolios and see your total in one currency
• Be alerted to new Warning Signs or Risks via email or mobile
• Track the Fair Value of your stocks
Have feedback on this article? Concerned about the content? Get in touch with us directly. Alternatively, email editorial-team (at) simplywallst.com.
This article by Simply Wall St is general in nature. We provide commentary based on historical data and analyst forecasts only using an unbiased methodology and our articles are not intended to be financial advice. It does not constitute a recommendation to buy or sell any stock, and does not take account of your objectives, or your financial situation. We aim to bring you long-term focused analysis driven by fundamental data. Note that our analysis may not factor in the latest price-sensitive company announcements or qualitative material. Simply Wall St has no position in any stocks mentioned.
About SHSE:603605
Proya CosmeticsLtd
A beauty and personal care company, researches, develops, produces, and sells cosmetics in China.
Very undervalued with excellent balance sheet.
Market Insights

Community Narratives


