Advertisement
- Taiwan
- /
- Semiconductors
- /
- TWSE:3711
Global Growth Companies With High Insider Ownership To Watch

Simply Wall St
Reviewed by Simply Wall St

As global markets navigate a landscape of rising consumer inflation and robust corporate earnings, indices like the S&P 500 and Nasdaq Composite have reached new highs, reflecting investor optimism. Amidst this backdrop, growth companies with high insider ownership are particularly intriguing; their potential for innovation and alignment of interests between insiders and shareholders can offer unique opportunities in today's market environment.
Top 10 Growth Companies With High Insider Ownership Globally
| Name | Insider Ownership | Earnings Growth |
| Zhejiang Leapmotor Technology (SEHK:9863) | 15.6% | 61% |
| Shanghai Huace Navigation Technology (SZSE:300627) | 24.3% | 23.5% |
| Pharma Mar (BME:PHM) | 11.8% | 43.3% |
| Novoray (SHSE:688300) | 23.6% | 28.2% |
| M31 Technology (TPEX:6643) | 30.8% | 63.4% |
| Laopu Gold (SEHK:6181) | 35.5% | 42.6% |
| KebNi (OM:KEBNI B) | 38.3% | 94.5% |
| Gold Circuit Electronics (TWSE:2368) | 31.4% | 25.9% |
| Fulin Precision (SZSE:300432) | 13.6% | 43.7% |
| Elliptic Laboratories (OB:ELABS) | 24.4% | 79% |
Let's uncover some gems from our specialized screener.
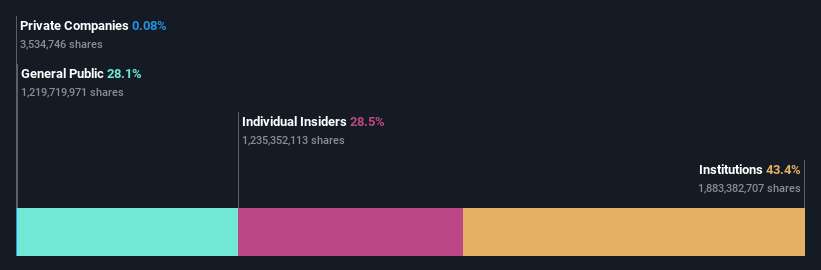
Runben Biotechnology (SHSE:603193)
Simply Wall St Growth Rating: ★★★★★☆
Overview: Runben Biotechnology Co., Ltd. focuses on the research, production, and sale of mosquito repellent products, baby care products, and essential oil products, with a market cap of CN¥11.99 billion.
Operations: The company's revenue primarily comes from its personal products segment, totaling CN¥1.39 billion.
Insider Ownership: 29.2%
Revenue Growth Forecast: 24.2% p.a.
Runben Biotechnology is experiencing robust revenue growth, forecasted at 24.2% annually, surpassing the CN market average. Despite a high Price-To-Earnings ratio of 42.7x, it remains below the industry average. Earnings are expected to grow significantly at 24.33% per year over the next three years, outpacing market expectations. Recent Q1 results showed strong performance with sales reaching CNY 240.03 million and net income increasing to CNY 44.2 million from last year’s figures.
- Click here to discover the nuances of Runben Biotechnology with our detailed analytical future growth report.
- The analysis detailed in our Runben Biotechnology valuation report hints at an inflated share price compared to its estimated value.
Shanghai Huace Navigation Technology (SZSE:300627)
Simply Wall St Growth Rating: ★★★★★★
Overview: Shanghai Huace Navigation Technology Ltd. operates in the field of navigation technology and has a market capitalization of CN¥27.70 billion.
Operations: Shanghai Huace Navigation Technology Ltd. generates revenue from its operations in the navigation technology sector.
Insider Ownership: 24.3%
Revenue Growth Forecast: 24.5% p.a.
Shanghai Huace Navigation Technology is poised for significant growth, with earnings expected to increase by 23.5% annually over the next three years, outpacing the CN market. Revenue is also forecasted to grow at 24.5% per year, surpassing market averages. The company's recent Q1 results showed strong performance with sales rising to CNY 789.12 million and net income reaching CNY 142.74 million from last year’s figures, reflecting robust operational momentum despite a lower-than-industry-average Price-To-Earnings ratio of 44.8x.
- Click here and access our complete growth analysis report to understand the dynamics of Shanghai Huace Navigation Technology.
- Our expertly prepared valuation report Shanghai Huace Navigation Technology implies its share price may be too high.
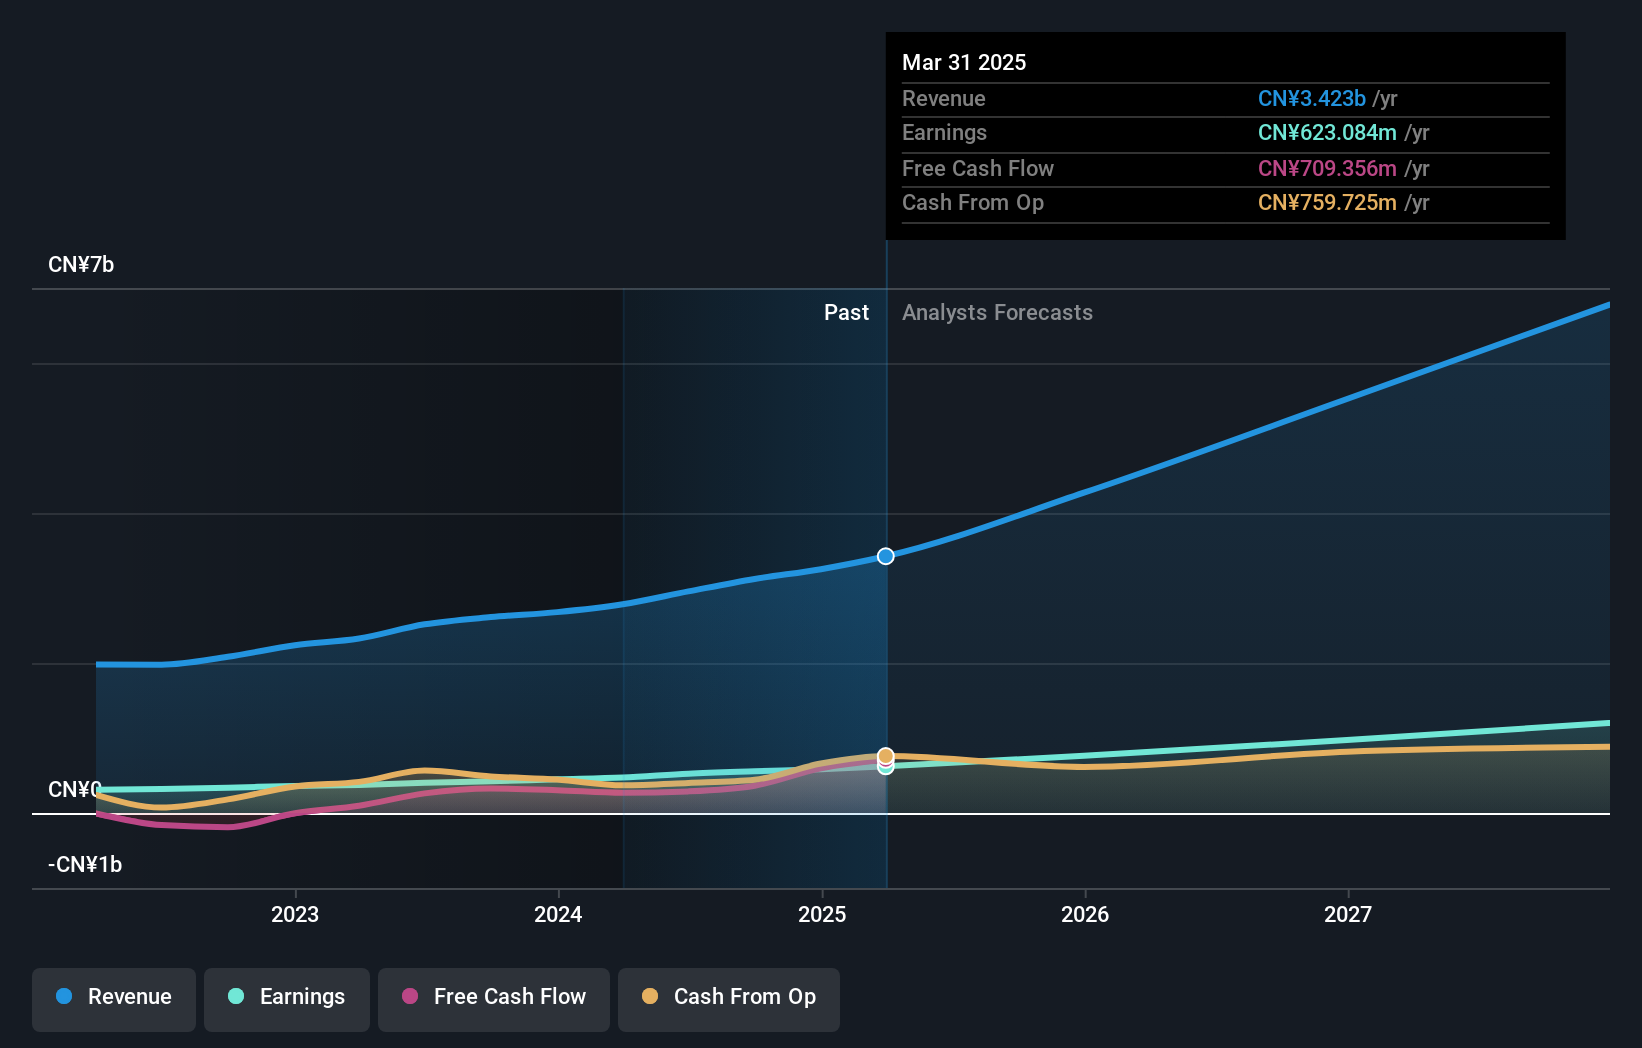
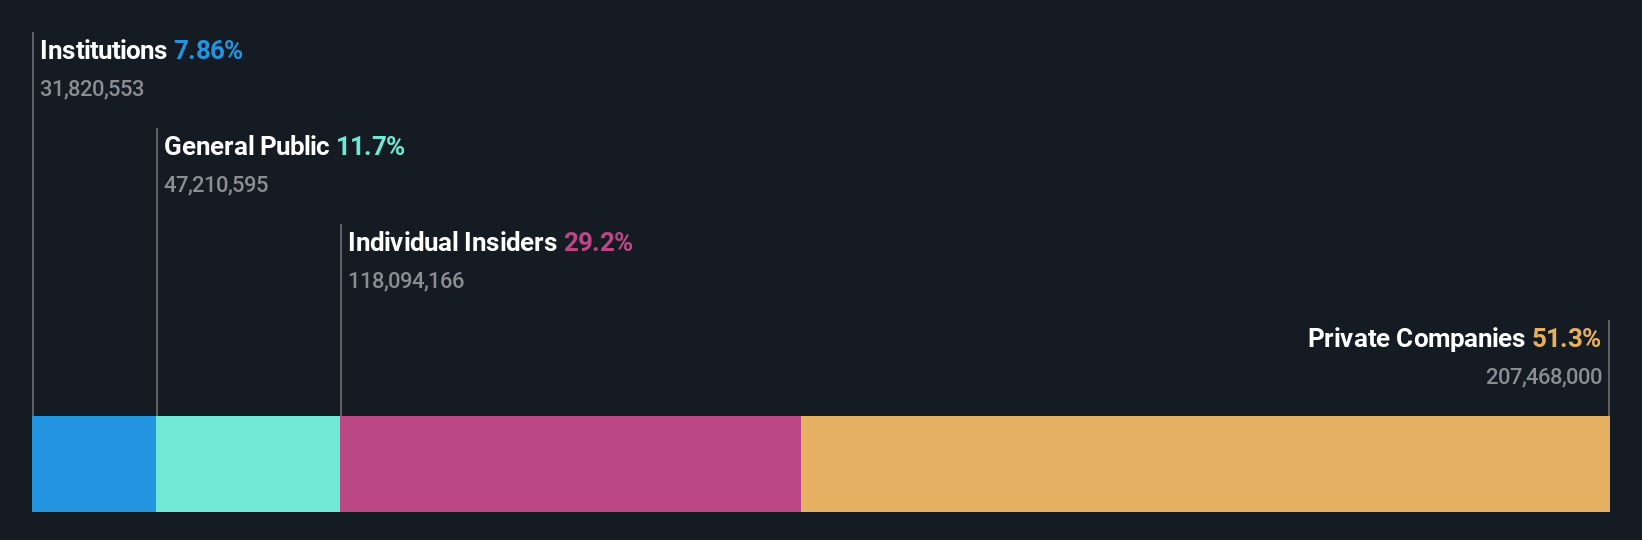
ASE Technology Holding (TWSE:3711)
Simply Wall St Growth Rating: ★★★★☆☆
Overview: ASE Technology Holding Co., Ltd. and its subsidiaries offer semiconductor manufacturing services, including assembly and testing, across the United States, Taiwan, Europe, Asia, and globally with a market cap of approximately NT$656.25 billion.
Operations: The company's revenue segments include NT$58.94 billion from Testing, NT$276.77 billion from Packaging, and NT$310.28 billion from the Electronic Assembly Segment.
Insider Ownership: 28.5%
Revenue Growth Forecast: 10.9% p.a.
ASE Technology Holding shows potential for growth with earnings projected to increase by 24.9% annually over the next three years, outpacing the TW market. Recent revenue figures highlight a positive trend, with Q2 net revenues reaching TWD 150.75 billion compared to TWD 140.24 billion last year. However, its dividend yield of 3.45% is not well covered by free cash flows, and the stock trades significantly below estimated fair value despite low forecasted return on equity at 16.1%.
- Take a closer look at ASE Technology Holding's potential here in our earnings growth report.
- Our expertly prepared valuation report ASE Technology Holding implies its share price may be lower than expected.
Turning Ideas Into Actions
- Gain an insight into the universe of 813 Fast Growing Global Companies With High Insider Ownership by clicking here.
- Searching for a Fresh Perspective? AI is about to change healthcare. These 26 stocks are working on everything from early diagnostics to drug discovery. The best part - they are all under $10b in market cap - there's still time to get in early.
This article by Simply Wall St is general in nature. We provide commentary based on historical data and analyst forecasts only using an unbiased methodology and our articles are not intended to be financial advice. It does not constitute a recommendation to buy or sell any stock, and does not take account of your objectives, or your financial situation. We aim to bring you long-term focused analysis driven by fundamental data. Note that our analysis may not factor in the latest price-sensitive company announcements or qualitative material. Simply Wall St has no position in any stocks mentioned.The analysis only considers stock directly held by insiders. It does not include indirectly owned stock through other vehicles such as corporate and/or trust entities. All forecast revenue and earnings growth rates quoted are in terms of annualised (per annum) growth rates over 1-3 years.
New: Manage All Your Stock Portfolios in One Place
We've created the ultimate portfolio companion for stock investors, and it's free.
• Connect an unlimited number of Portfolios and see your total in one currency
• Be alerted to new Warning Signs or Risks via email or mobile
• Track the Fair Value of your stocks
Have feedback on this article? Concerned about the content? Get in touch with us directly. Alternatively, email editorial-team@simplywallst.com
About TWSE:3711
ASE Technology Holding
Provides semiconductor manufacturing services in assembly and testing in the United States, Taiwan, Europe, Asia, and internationally.
Flawless balance sheet and good value.
Similar Companies
Market Insights

Advertisement
Community Narratives
Pole position to benefit from GENIUS Act
Fair Value US$233.04|59.7% undervalued
CH
Community Contributor
IREN will transform from bitcoin miner to leader in AI infrastructure
Fair Value US$21.48|13.5% undervalued
KA
Community Contributor
Behind the Assay: XRF Scientific’s Role in Modern Mining Economics
Fair Value AU$2.10|1.4% undervalued
RO
Community Contributor