- China
- /
- Medical Equipment
- /
- SHSE:688277
More Unpleasant Surprises Could Be In Store For Tinavi Medical Technologies Co.,Ltd.'s (SHSE:688277) Shares After Tumbling 26%


Unfortunately for some shareholders, the Tinavi Medical Technologies Co.,Ltd. (SHSE:688277) share price has dived 26% in the last thirty days, prolonging recent pain. For any long-term shareholders, the last month ends a year to forget by locking in a 52% share price decline.
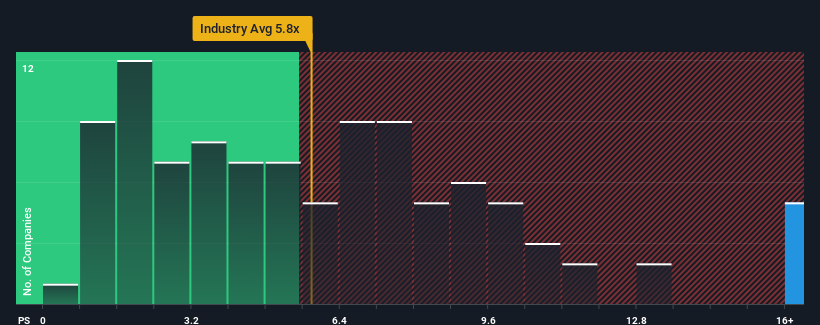
Although its price has dipped substantially, Tinavi Medical TechnologiesLtd may still be sending very bearish signals at the moment with a price-to-sales (or "P/S") ratio of 16.6x, since almost half of all companies in the Medical Equipment industry in China have P/S ratios under 5.8x and even P/S lower than 2x are not unusual. Although, it's not wise to just take the P/S at face value as there may be an explanation why it's so lofty.
View our latest analysis for Tinavi Medical TechnologiesLtd
How Tinavi Medical TechnologiesLtd Has Been Performing
Recent times have been quite advantageous for Tinavi Medical TechnologiesLtd as its revenue has been rising very briskly. Perhaps the market is expecting future revenue performance to outperform the wider market, which has seemingly got people interested in the stock. If not, then existing shareholders might be a little nervous about the viability of the share price.
Want the full picture on earnings, revenue and cash flow for the company? Then our free report on Tinavi Medical TechnologiesLtd will help you shine a light on its historical performance.Is There Enough Revenue Growth Forecasted For Tinavi Medical TechnologiesLtd?
The only time you'd be truly comfortable seeing a P/S as steep as Tinavi Medical TechnologiesLtd's is when the company's growth is on track to outshine the industry decidedly.
Taking a look back first, we see that the company grew revenue by an impressive 34% last year. The strong recent performance means it was also able to grow revenue by 54% in total over the last three years. Therefore, it's fair to say the revenue growth recently has been superb for the company.
This is in contrast to the rest of the industry, which is expected to grow by 24% over the next year, materially higher than the company's recent medium-term annualised growth rates.
With this information, we find it concerning that Tinavi Medical TechnologiesLtd is trading at a P/S higher than the industry. Apparently many investors in the company are way more bullish than recent times would indicate and aren't willing to let go of their stock at any price. Only the boldest would assume these prices are sustainable as a continuation of recent revenue trends is likely to weigh heavily on the share price eventually.
What Does Tinavi Medical TechnologiesLtd's P/S Mean For Investors?
Tinavi Medical TechnologiesLtd's shares may have suffered, but its P/S remains high. It's argued the price-to-sales ratio is an inferior measure of value within certain industries, but it can be a powerful business sentiment indicator.
Our examination of Tinavi Medical TechnologiesLtd revealed its poor three-year revenue trends aren't detracting from the P/S as much as we though, given they look worse than current industry expectations. When we see slower than industry revenue growth but an elevated P/S, there's considerable risk of the share price declining, sending the P/S lower. Unless the recent medium-term conditions improve markedly, it's very challenging to accept these the share price as being reasonable.
Before you take the next step, you should know about the 1 warning sign for Tinavi Medical TechnologiesLtd that we have uncovered.
Of course, profitable companies with a history of great earnings growth are generally safer bets. So you may wish to see this free collection of other companies that have reasonable P/E ratios and have grown earnings strongly.
If you're looking to trade Tinavi Medical TechnologiesLtd, open an account with the lowest-cost platform trusted by professionals, Interactive Brokers.
With clients in over 200 countries and territories, and access to 160 markets, IBKR lets you trade stocks, options, futures, forex, bonds and funds from a single integrated account.
Enjoy no hidden fees, no account minimums, and FX conversion rates as low as 0.03%, far better than what most brokers offer.
Sponsored ContentValuation is complex, but we're here to simplify it.
Discover if Tinavi Medical TechnologiesLtd might be undervalued or overvalued with our detailed analysis, featuring fair value estimates, potential risks, dividends, insider trades, and its financial condition.
Access Free AnalysisHave feedback on this article? Concerned about the content? Get in touch with us directly. Alternatively, email editorial-team (at) simplywallst.com.
This article by Simply Wall St is general in nature. We provide commentary based on historical data and analyst forecasts only using an unbiased methodology and our articles are not intended to be financial advice. It does not constitute a recommendation to buy or sell any stock, and does not take account of your objectives, or your financial situation. We aim to bring you long-term focused analysis driven by fundamental data. Note that our analysis may not factor in the latest price-sensitive company announcements or qualitative material. Simply Wall St has no position in any stocks mentioned.
About SHSE:688277
Tinavi Medical TechnologiesLtd
Engages in the research and development, production, sale, market, service, and clinical application of orthopedic surgery robots and related technologies.
Excellent balance sheet minimal.
Similar Companies
Market Insights

Community Narratives


