- China
- /
- Medical Equipment
- /
- SHSE:688013
Improved Earnings Required Before Touchstone International Medical Science Co., Ltd. (SHSE:688013) Stock's 25% Jump Looks Justified


Those holding Touchstone International Medical Science Co., Ltd. (SHSE:688013) shares would be relieved that the share price has rebounded 25% in the last thirty days, but it needs to keep going to repair the recent damage it has caused to investor portfolios. Not all shareholders will be feeling jubilant, since the share price is still down a very disappointing 29% in the last twelve months.
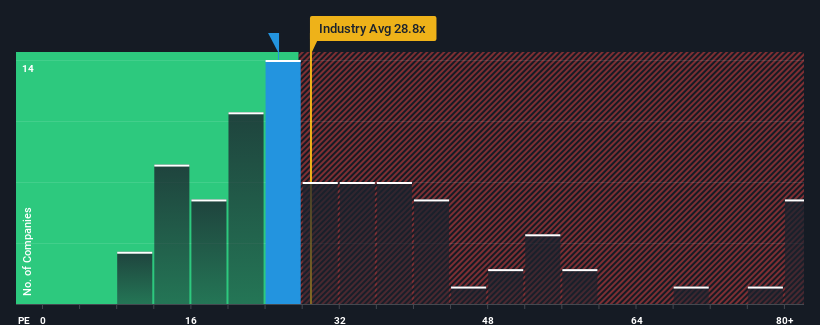
In spite of the firm bounce in price, given about half the companies in China have price-to-earnings ratios (or "P/E's") above 30x, you may still consider Touchstone International Medical Science as an attractive investment with its 25.3x P/E ratio. However, the P/E might be low for a reason and it requires further investigation to determine if it's justified.
The earnings growth achieved at Touchstone International Medical Science over the last year would be more than acceptable for most companies. One possibility is that the P/E is low because investors think this respectable earnings growth might actually underperform the broader market in the near future. If you like the company, you'd be hoping this isn't the case so that you could potentially pick up some stock while it's out of favour.
View our latest analysis for Touchstone International Medical Science
How Is Touchstone International Medical Science's Growth Trending?
Touchstone International Medical Science's P/E ratio would be typical for a company that's only expected to deliver limited growth, and importantly, perform worse than the market.
If we review the last year of earnings growth, the company posted a terrific increase of 20%. The latest three year period has also seen a 23% overall rise in EPS, aided extensively by its short-term performance. So we can start by confirming that the company has actually done a good job of growing earnings over that time.
Comparing that to the market, which is predicted to deliver 41% growth in the next 12 months, the company's momentum is weaker based on recent medium-term annualised earnings results.
In light of this, it's understandable that Touchstone International Medical Science's P/E sits below the majority of other companies. Apparently many shareholders weren't comfortable holding on to something they believe will continue to trail the bourse.
What We Can Learn From Touchstone International Medical Science's P/E?
The latest share price surge wasn't enough to lift Touchstone International Medical Science's P/E close to the market median. Generally, our preference is to limit the use of the price-to-earnings ratio to establishing what the market thinks about the overall health of a company.
We've established that Touchstone International Medical Science maintains its low P/E on the weakness of its recent three-year growth being lower than the wider market forecast, as expected. Right now shareholders are accepting the low P/E as they concede future earnings probably won't provide any pleasant surprises. If recent medium-term earnings trends continue, it's hard to see the share price rising strongly in the near future under these circumstances.
It is also worth noting that we have found 1 warning sign for Touchstone International Medical Science that you need to take into consideration.
Of course, you might also be able to find a better stock than Touchstone International Medical Science. So you may wish to see this free collection of other companies that have reasonable P/E ratios and have grown earnings strongly.
Valuation is complex, but we're here to simplify it.
Discover if Touchstone International Medical Science might be undervalued or overvalued with our detailed analysis, featuring fair value estimates, potential risks, dividends, insider trades, and its financial condition.
Access Free AnalysisHave feedback on this article? Concerned about the content? Get in touch with us directly. Alternatively, email editorial-team (at) simplywallst.com.
This article by Simply Wall St is general in nature. We provide commentary based on historical data and analyst forecasts only using an unbiased methodology and our articles are not intended to be financial advice. It does not constitute a recommendation to buy or sell any stock, and does not take account of your objectives, or your financial situation. We aim to bring you long-term focused analysis driven by fundamental data. Note that our analysis may not factor in the latest price-sensitive company announcements or qualitative material. Simply Wall St has no position in any stocks mentioned.
About SHSE:688013
Touchstone International Medical Science
Touchstone International Medical Science Co., Ltd.
Solid track record with excellent balance sheet.
Market Insights

Community Narratives


