Subdued Growth No Barrier To HaiXin Foods Co.,Ltd (SZSE:002702) With Shares Advancing 33%


Those holding HaiXin Foods Co.,Ltd (SZSE:002702) shares would be relieved that the share price has rebounded 33% in the last thirty days, but it needs to keep going to repair the recent damage it has caused to investor portfolios. The bad news is that even after the stocks recovery in the last 30 days, shareholders are still underwater by about 5.8% over the last year.
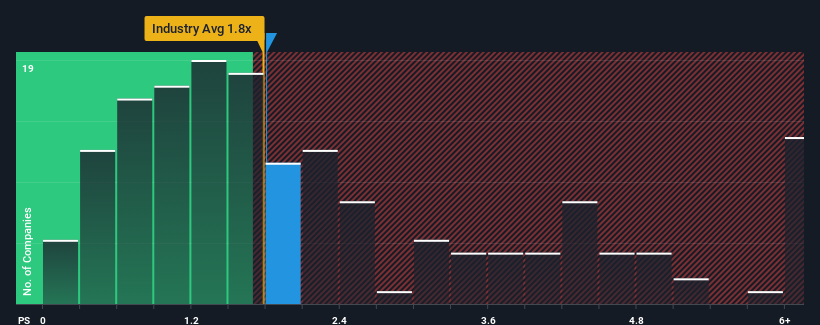
Even after such a large jump in price, you could still be forgiven for feeling indifferent about HaiXin FoodsLtd's P/S ratio of 1.8x, since the median price-to-sales (or "P/S") ratio for the Food industry in China is about the same. However, investors might be overlooking a clear opportunity or potential setback if there is no rational basis for the P/S.
View our latest analysis for HaiXin FoodsLtd
What Does HaiXin FoodsLtd's P/S Mean For Shareholders?
The recent revenue growth at HaiXin FoodsLtd would have to be considered satisfactory if not spectacular. Perhaps the expectation moving forward is that the revenue growth will track in line with the wider industry for the near term, which has kept the P/S subdued. Those who are bullish on HaiXin FoodsLtd will be hoping that this isn't the case, so that they can pick up the stock at a lower valuation.
Although there are no analyst estimates available for HaiXin FoodsLtd, take a look at this free data-rich visualisation to see how the company stacks up on earnings, revenue and cash flow.Do Revenue Forecasts Match The P/S Ratio?
There's an inherent assumption that a company should be matching the industry for P/S ratios like HaiXin FoodsLtd's to be considered reasonable.
If we review the last year of revenue growth, the company posted a worthy increase of 6.3%. The latest three year period has also seen a 5.5% overall rise in revenue, aided somewhat by its short-term performance. Accordingly, shareholders would have probably been satisfied with the medium-term rates of revenue growth.
Comparing that to the industry, which is predicted to deliver 16% growth in the next 12 months, the company's momentum is weaker, based on recent medium-term annualised revenue results.
In light of this, it's curious that HaiXin FoodsLtd's P/S sits in line with the majority of other companies. It seems most investors are ignoring the fairly limited recent growth rates and are willing to pay up for exposure to the stock. Maintaining these prices will be difficult to achieve as a continuation of recent revenue trends is likely to weigh down the shares eventually.
What Does HaiXin FoodsLtd's P/S Mean For Investors?
HaiXin FoodsLtd appears to be back in favour with a solid price jump bringing its P/S back in line with other companies in the industry Using the price-to-sales ratio alone to determine if you should sell your stock isn't sensible, however it can be a practical guide to the company's future prospects.
Our examination of HaiXin FoodsLtd revealed its poor three-year revenue trends aren't resulting in a lower P/S as per our expectations, given they look worse than current industry outlook. Right now we are uncomfortable with the P/S as this revenue performance isn't likely to support a more positive sentiment for long. If recent medium-term revenue trends continue, the probability of a share price decline will become quite substantial, placing shareholders at risk.
You should always think about risks. Case in point, we've spotted 5 warning signs for HaiXin FoodsLtd you should be aware of, and 2 of them are concerning.
It's important to make sure you look for a great company, not just the first idea you come across. So if growing profitability aligns with your idea of a great company, take a peek at this free list of interesting companies with strong recent earnings growth (and a low P/E).
If you're looking to trade HaiXin FoodsLtd, open an account with the lowest-cost platform trusted by professionals, Interactive Brokers.
With clients in over 200 countries and territories, and access to 160 markets, IBKR lets you trade stocks, options, futures, forex, bonds and funds from a single integrated account.
Enjoy no hidden fees, no account minimums, and FX conversion rates as low as 0.03%, far better than what most brokers offer.
Sponsored ContentValuation is complex, but we're here to simplify it.
Discover if HaiXin FoodsLtd might be undervalued or overvalued with our detailed analysis, featuring fair value estimates, potential risks, dividends, insider trades, and its financial condition.
Access Free AnalysisHave feedback on this article? Concerned about the content? Get in touch with us directly. Alternatively, email editorial-team (at) simplywallst.com.
This article by Simply Wall St is general in nature. We provide commentary based on historical data and analyst forecasts only using an unbiased methodology and our articles are not intended to be financial advice. It does not constitute a recommendation to buy or sell any stock, and does not take account of your objectives, or your financial situation. We aim to bring you long-term focused analysis driven by fundamental data. Note that our analysis may not factor in the latest price-sensitive company announcements or qualitative material. Simply Wall St has no position in any stocks mentioned.
About SZSE:002702
HaiXin FoodsLtd
Engages in the production and sale of quick-frozen fish and meat products, rice and noodle products, room temperature snack food products, and quick-frozen dishes.
Adequate balance sheet and slightly overvalued.
Market Insights

Community Narratives


