Optimistic Investors Push Shandong Huifa Foodstuff Co.,Ltd. (SHSE:603536) Shares Up 31% But Growth Is Lacking


Those holding Shandong Huifa Foodstuff Co.,Ltd. (SHSE:603536) shares would be relieved that the share price has rebounded 31% in the last thirty days, but it needs to keep going to repair the recent damage it has caused to investor portfolios. Looking back a bit further, it's encouraging to see the stock is up 49% in the last year.
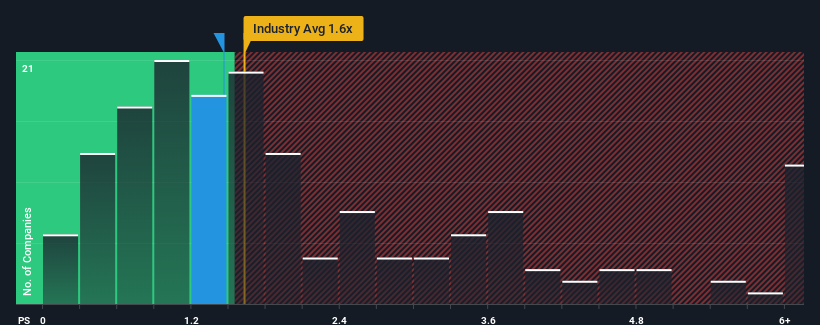
In spite of the firm bounce in price, there still wouldn't be many who think Shandong Huifa FoodstuffLtd's price-to-sales (or "P/S") ratio of 1.5x is worth a mention when the median P/S in China's Food industry is similar at about 1.6x. However, investors might be overlooking a clear opportunity or potential setback if there is no rational basis for the P/S.
See our latest analysis for Shandong Huifa FoodstuffLtd
What Does Shandong Huifa FoodstuffLtd's P/S Mean For Shareholders?
The revenue growth achieved at Shandong Huifa FoodstuffLtd over the last year would be more than acceptable for most companies. One possibility is that the P/S is moderate because investors think this respectable revenue growth might not be enough to outperform the broader industry in the near future. If that doesn't eventuate, then existing shareholders probably aren't too pessimistic about the future direction of the share price.
We don't have analyst forecasts, but you can see how recent trends are setting up the company for the future by checking out our free report on Shandong Huifa FoodstuffLtd's earnings, revenue and cash flow.Do Revenue Forecasts Match The P/S Ratio?
Shandong Huifa FoodstuffLtd's P/S ratio would be typical for a company that's only expected to deliver moderate growth, and importantly, perform in line with the industry.
Retrospectively, the last year delivered a decent 8.1% gain to the company's revenues. The latest three year period has also seen a 28% overall rise in revenue, aided somewhat by its short-term performance. Accordingly, shareholders would have probably been satisfied with the medium-term rates of revenue growth.
Comparing that to the industry, which is predicted to deliver 16% growth in the next 12 months, the company's momentum is weaker, based on recent medium-term annualised revenue results.
In light of this, it's curious that Shandong Huifa FoodstuffLtd's P/S sits in line with the majority of other companies. It seems most investors are ignoring the fairly limited recent growth rates and are willing to pay up for exposure to the stock. They may be setting themselves up for future disappointment if the P/S falls to levels more in line with recent growth rates.
What Does Shandong Huifa FoodstuffLtd's P/S Mean For Investors?
Its shares have lifted substantially and now Shandong Huifa FoodstuffLtd's P/S is back within range of the industry median. Typically, we'd caution against reading too much into price-to-sales ratios when settling on investment decisions, though it can reveal plenty about what other market participants think about the company.
We've established that Shandong Huifa FoodstuffLtd's average P/S is a bit surprising since its recent three-year growth is lower than the wider industry forecast. Right now we are uncomfortable with the P/S as this revenue performance isn't likely to support a more positive sentiment for long. Unless the recent medium-term conditions improve, it's hard to accept the current share price as fair value.
We don't want to rain on the parade too much, but we did also find 2 warning signs for Shandong Huifa FoodstuffLtd that you need to be mindful of.
If companies with solid past earnings growth is up your alley, you may wish to see this free collection of other companies with strong earnings growth and low P/E ratios.
New: Manage All Your Stock Portfolios in One Place
We've created the ultimate portfolio companion for stock investors, and it's free.
• Connect an unlimited number of Portfolios and see your total in one currency
• Be alerted to new Warning Signs or Risks via email or mobile
• Track the Fair Value of your stocks
Have feedback on this article? Concerned about the content? Get in touch with us directly. Alternatively, email editorial-team (at) simplywallst.com.
This article by Simply Wall St is general in nature. We provide commentary based on historical data and analyst forecasts only using an unbiased methodology and our articles are not intended to be financial advice. It does not constitute a recommendation to buy or sell any stock, and does not take account of your objectives, or your financial situation. We aim to bring you long-term focused analysis driven by fundamental data. Note that our analysis may not factor in the latest price-sensitive company announcements or qualitative material. Simply Wall St has no position in any stocks mentioned.
About SHSE:603536
Shandong Huifa FoodstuffLtd
Engages in the research, development, production, and sale of quick-frozen conditioning products in China and internationally.
Mediocre balance sheet and slightly overvalued.
Market Insights

Community Narratives


