- China
- /
- Oil and Gas
- /
- SHSE:601872
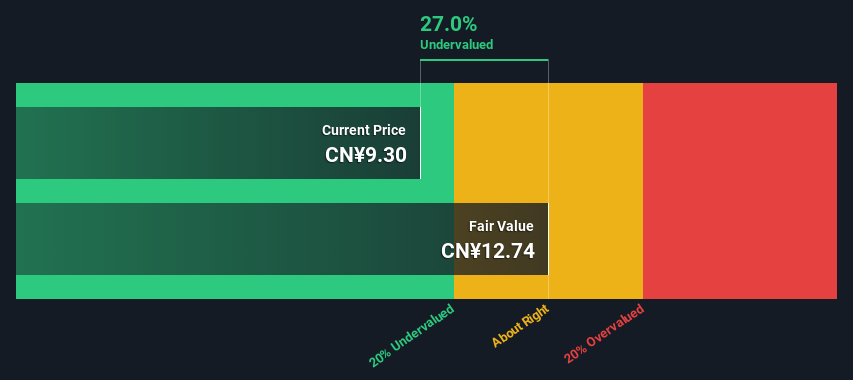
Is There An Opportunity With China Merchants Energy Shipping Co., Ltd.'s (SHSE:601872) 27% Undervaluation?


Key Insights
- The projected fair value for China Merchants Energy Shipping is CN¥12.74 based on 2 Stage Free Cash Flow to Equity
- China Merchants Energy Shipping's CN¥9.30 share price signals that it might be 27% undervalued
- Our fair value estimate is 26% higher than China Merchants Energy Shipping's analyst price target of CN¥10.14
In this article we are going to estimate the intrinsic value of China Merchants Energy Shipping Co., Ltd. (SHSE:601872) by taking the expected future cash flows and discounting them to today's value. Our analysis will employ the Discounted Cash Flow (DCF) model. Believe it or not, it's not too difficult to follow, as you'll see from our example!
Remember though, that there are many ways to estimate a company's value, and a DCF is just one method. Anyone interested in learning a bit more about intrinsic value should have a read of the Simply Wall St analysis model.
View our latest analysis for China Merchants Energy Shipping
The Calculation
We use what is known as a 2-stage model, which simply means we have two different periods of growth rates for the company's cash flows. Generally the first stage is higher growth, and the second stage is a lower growth phase. To begin with, we have to get estimates of the next ten years of cash flows. Where possible we use analyst estimates, but when these aren't available we extrapolate the previous free cash flow (FCF) from the last estimate or reported value. We assume companies with shrinking free cash flow will slow their rate of shrinkage, and that companies with growing free cash flow will see their growth rate slow, over this period. We do this to reflect that growth tends to slow more in the early years than it does in later years.
Generally we assume that a dollar today is more valuable than a dollar in the future, so we discount the value of these future cash flows to their estimated value in today's dollars:
10-year free cash flow (FCF) estimate
| 2024 | 2025 | 2026 | 2027 | 2028 | 2029 | 2030 | 2031 | 2032 | 2033 | |
| Levered FCF (CN¥, Millions) | CN¥5.46b | CN¥6.93b | CN¥7.36b | CN¥7.71b | CN¥8.03b | CN¥8.33b | CN¥8.63b | CN¥8.91b | CN¥9.20b | CN¥9.49b |
| Growth Rate Estimate Source | Analyst x1 | Analyst x2 | Analyst x2 | Est @ 4.73% | Est @ 4.18% | Est @ 3.79% | Est @ 3.53% | Est @ 3.34% | Est @ 3.21% | Est @ 3.11% |
| Present Value (CN¥, Millions) Discounted @ 9.8% | CN¥5.0k | CN¥5.8k | CN¥5.6k | CN¥5.3k | CN¥5.0k | CN¥4.8k | CN¥4.5k | CN¥4.2k | CN¥4.0k | CN¥3.7k |
("Est" = FCF growth rate estimated by Simply Wall St)
Present Value of 10-year Cash Flow (PVCF) = CN¥48b
The second stage is also known as Terminal Value, this is the business's cash flow after the first stage. For a number of reasons a very conservative growth rate is used that cannot exceed that of a country's GDP growth. In this case we have used the 5-year average of the 10-year government bond yield (2.9%) to estimate future growth. In the same way as with the 10-year 'growth' period, we discount future cash flows to today's value, using a cost of equity of 9.8%.
Terminal Value (TV)= FCF2033 × (1 + g) ÷ (r – g) = CN¥9.5b× (1 + 2.9%) ÷ (9.8%– 2.9%) = CN¥142b
Present Value of Terminal Value (PVTV)= TV / (1 + r)10= CN¥142b÷ ( 1 + 9.8%)10= CN¥56b
The total value is the sum of cash flows for the next ten years plus the discounted terminal value, which results in the Total Equity Value, which in this case is CN¥104b. The last step is to then divide the equity value by the number of shares outstanding. Compared to the current share price of CN¥9.3, the company appears a touch undervalued at a 27% discount to where the stock price trades currently. Remember though, that this is just an approximate valuation, and like any complex formula - garbage in, garbage out.
The Assumptions
The calculation above is very dependent on two assumptions. The first is the discount rate and the other is the cash flows. If you don't agree with these result, have a go at the calculation yourself and play with the assumptions. The DCF also does not consider the possible cyclicality of an industry, or a company's future capital requirements, so it does not give a full picture of a company's potential performance. Given that we are looking at China Merchants Energy Shipping as potential shareholders, the cost of equity is used as the discount rate, rather than the cost of capital (or weighted average cost of capital, WACC) which accounts for debt. In this calculation we've used 9.8%, which is based on a levered beta of 1.221. Beta is a measure of a stock's volatility, compared to the market as a whole. We get our beta from the industry average beta of globally comparable companies, with an imposed limit between 0.8 and 2.0, which is a reasonable range for a stable business.
SWOT Analysis for China Merchants Energy Shipping
- Earnings growth over the past year exceeded the industry.
- Debt is not viewed as a risk.
- Dividends are covered by earnings and cash flows.
- Dividend is in the top 25% of dividend payers in the market.
- Earnings growth over the past year is below its 5-year average.
- Annual earnings are forecast to grow for the next 3 years.
- Good value based on P/E ratio and estimated fair value.
- Annual earnings are forecast to grow slower than the Chinese market.
Moving On:
Valuation is only one side of the coin in terms of building your investment thesis, and it ideally won't be the sole piece of analysis you scrutinize for a company. DCF models are not the be-all and end-all of investment valuation. Rather it should be seen as a guide to "what assumptions need to be true for this stock to be under/overvalued?" For instance, if the terminal value growth rate is adjusted slightly, it can dramatically alter the overall result. Why is the intrinsic value higher than the current share price? For China Merchants Energy Shipping, there are three pertinent factors you should further research:
- Risks: Every company has them, and we've spotted 1 warning sign for China Merchants Energy Shipping you should know about.
- Future Earnings: How does 601872's growth rate compare to its peers and the wider market? Dig deeper into the analyst consensus number for the upcoming years by interacting with our free analyst growth expectation chart.
- Other High Quality Alternatives: Do you like a good all-rounder? Explore our interactive list of high quality stocks to get an idea of what else is out there you may be missing!
PS. The Simply Wall St app conducts a discounted cash flow valuation for every stock on the SHSE every day. If you want to find the calculation for other stocks just search here.
New: AI Stock Screener & Alerts
Our new AI Stock Screener scans the market every day to uncover opportunities.
• Dividend Powerhouses (3%+ Yield)
• Undervalued Small Caps with Insider Buying
• High growth Tech and AI Companies
Or build your own from over 50 metrics.
Have feedback on this article? Concerned about the content? Get in touch with us directly. Alternatively, email editorial-team (at) simplywallst.com.
This article by Simply Wall St is general in nature. We provide commentary based on historical data and analyst forecasts only using an unbiased methodology and our articles are not intended to be financial advice. It does not constitute a recommendation to buy or sell any stock, and does not take account of your objectives, or your financial situation. We aim to bring you long-term focused analysis driven by fundamental data. Note that our analysis may not factor in the latest price-sensitive company announcements or qualitative material. Simply Wall St has no position in any stocks mentioned.
About SHSE:601872
China Merchants Energy Shipping
China Merchants Energy Shipping Co., Ltd.
Undervalued average dividend payer.
Market Insights

Community Narratives

