
Advertisement
- China
- /
- Diversified Financial
- /
- SZSE:002647
The Market Doesn't Like What It Sees From Rendong Holdings Co., Ltd.'s (SZSE:002647) Revenues Yet As Shares Tumble 27%

To the annoyance of some shareholders, Rendong Holdings Co., Ltd. (SZSE:002647) shares are down a considerable 27% in the last month, which continues a horrid run for the company. Instead of being rewarded, shareholders who have already held through the last twelve months are now sitting on a 41% share price drop.
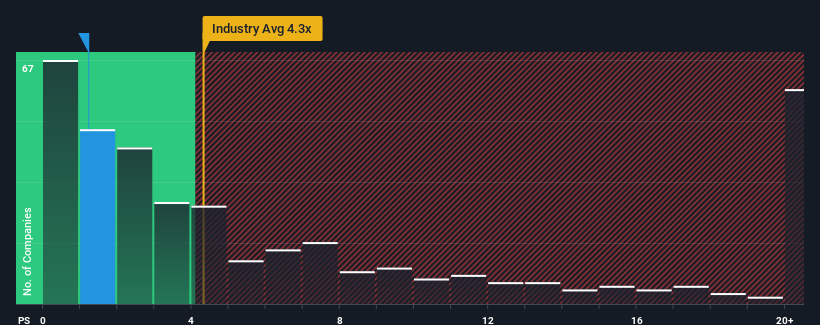
After such a large drop in price, when close to half the companies operating in China's Diversified Financial industry have price-to-sales ratios (or "P/S") above 1.8x, you may consider Rendong Holdings as an enticing stock to check out with its 1.2x P/S ratio. However, the P/S might be low for a reason and it requires further investigation to determine if it's justified.
See our latest analysis for Rendong Holdings
What Does Rendong Holdings' Recent Performance Look Like?
We'd have to say that with no tangible growth over the last year, Rendong Holdings' revenue has been unimpressive. One possibility is that the P/S is low because investors think this benign revenue growth rate will likely underperform the broader industry in the near future. If not, then existing shareholders may be feeling optimistic about the future direction of the share price.
Want the full picture on earnings, revenue and cash flow for the company? Then our free report on Rendong Holdings will help you shine a light on its historical performance.Is There Any Revenue Growth Forecasted For Rendong Holdings?
The only time you'd be truly comfortable seeing a P/S as low as Rendong Holdings' is when the company's growth is on track to lag the industry.
Retrospectively, the last year delivered virtually the same number to the company's top line as the year before. The lack of growth did nothing to help the company's aggregate three-year performance, which is an unsavory 35% drop in revenue. So unfortunately, we have to acknowledge that the company has not done a great job of growing revenue over that time.
In contrast to the company, the rest of the industry is expected to grow by 5.0% over the next year, which really puts the company's recent medium-term revenue decline into perspective.
With this in mind, we understand why Rendong Holdings' P/S is lower than most of its industry peers. Nonetheless, there's no guarantee the P/S has reached a floor yet with revenue going in reverse. There's potential for the P/S to fall to even lower levels if the company doesn't improve its top-line growth.
What Does Rendong Holdings' P/S Mean For Investors?
Rendong Holdings' P/S has taken a dip along with its share price. While the price-to-sales ratio shouldn't be the defining factor in whether you buy a stock or not, it's quite a capable barometer of revenue expectations.
As we suspected, our examination of Rendong Holdings revealed its shrinking revenue over the medium-term is contributing to its low P/S, given the industry is set to grow. Right now shareholders are accepting the low P/S as they concede future revenue probably won't provide any pleasant surprises either. If recent medium-term revenue trends continue, it's hard to see the share price moving strongly in either direction in the near future under these circumstances.
Plus, you should also learn about this 1 warning sign we've spotted with Rendong Holdings.
It's important to make sure you look for a great company, not just the first idea you come across. So if growing profitability aligns with your idea of a great company, take a peek at this free list of interesting companies with strong recent earnings growth (and a low P/E).
New: AI Stock Screener & Alerts
Our new AI Stock Screener scans the market every day to uncover opportunities.
• Dividend Powerhouses (3%+ Yield)
• Undervalued Small Caps with Insider Buying
• High growth Tech and AI Companies
Or build your own from over 50 metrics.
Have feedback on this article? Concerned about the content? Get in touch with us directly. Alternatively, email editorial-team (at) simplywallst.com.
This article by Simply Wall St is general in nature. We provide commentary based on historical data and analyst forecasts only using an unbiased methodology and our articles are not intended to be financial advice. It does not constitute a recommendation to buy or sell any stock, and does not take account of your objectives, or your financial situation. We aim to bring you long-term focused analysis driven by fundamental data. Note that our analysis may not factor in the latest price-sensitive company announcements or qualitative material. Simply Wall St has no position in any stocks mentioned.
About SZSE:002647
Adequate balance sheet very low.
Market Insights

Advertisement
Community Narratives

Apple: A Dying Star with an Overpriced Valuation
Fair Value US$177.34|18.9% overvalued
IN
Community Contributor
Avino a case for USD$20 per share within 5 years (assuming $3,500 gold, $100 silver and $4 copper).
Fair Value CA$26.79|87.5% undervalued
AG
Community Contributor
Riding the Defense Boom RENK Sees Revenue Climb at 15% CAGR by FY 2029
Fair Value €69.87|22.2% undervalued
CH
Community Contributor