- China
- /
- Capital Markets
- /
- SZSE:000958
The past five years for SPIC Industry-Finance Holdings (SZSE:000958) investors has not been profitable

In order to justify the effort of selecting individual stocks, it's worth striving to beat the returns from a market index fund. But even the best stock picker will only win with some selections. So we wouldn't blame long term SPIC Industry-Finance Holdings Co., Ltd. (SZSE:000958) shareholders for doubting their decision to hold, with the stock down 12% over a half decade.
So let's have a look and see if the longer term performance of the company has been in line with the underlying business' progress.
See our latest analysis for SPIC Industry-Finance Holdings
In his essay The Superinvestors of Graham-and-Doddsville Warren Buffett described how share prices do not always rationally reflect the value of a business. One way to examine how market sentiment has changed over time is to look at the interaction between a company's share price and its earnings per share (EPS).
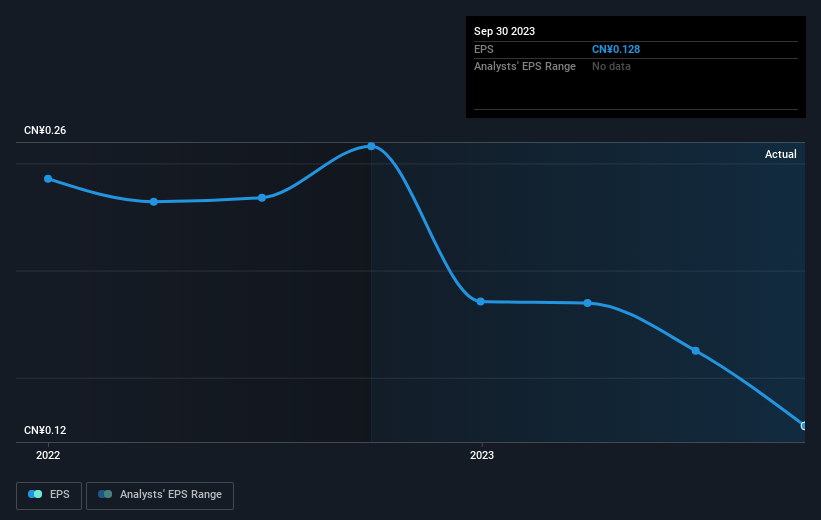
During the five years over which the share price declined, SPIC Industry-Finance Holdings' earnings per share (EPS) dropped by 0.6% each year. This reduction in EPS is less than the 2% annual reduction in the share price. This implies that the market was previously too optimistic about the stock.
You can see how EPS has changed over time in the image below (click on the chart to see the exact values).
It's probably worth noting that the CEO is paid less than the median at similar sized companies. It's always worth keeping an eye on CEO pay, but a more important question is whether the company will grow earnings throughout the years. Before buying or selling a stock, we always recommend a close examination of historic growth trends, available here..
What About Dividends?
As well as measuring the share price return, investors should also consider the total shareholder return (TSR). The TSR is a return calculation that accounts for the value of cash dividends (assuming that any dividend received was reinvested) and the calculated value of any discounted capital raisings and spin-offs. It's fair to say that the TSR gives a more complete picture for stocks that pay a dividend. As it happens, SPIC Industry-Finance Holdings' TSR for the last 5 years was -6.8%, which exceeds the share price return mentioned earlier. This is largely a result of its dividend payments!
A Different Perspective
While it's never nice to take a loss, SPIC Industry-Finance Holdings shareholders can take comfort that , including dividends,their trailing twelve month loss of 10% wasn't as bad as the market loss of around 19%. Unfortunately, last year's performance may indicate unresolved challenges, given that it's worse than the annualised loss of 1.3% over the last half decade. While some investors do well specializing in buying companies that are struggling (but nonetheless undervalued), don't forget that Buffett said that 'turnarounds seldom turn'. While it is well worth considering the different impacts that market conditions can have on the share price, there are other factors that are even more important. Consider for instance, the ever-present spectre of investment risk. We've identified 3 warning signs with SPIC Industry-Finance Holdings (at least 1 which is concerning) , and understanding them should be part of your investment process.
If you like to buy stocks alongside management, then you might just love this free list of companies. (Hint: insiders have been buying them).
Please note, the market returns quoted in this article reflect the market weighted average returns of stocks that currently trade on Chinese exchanges.
New: Manage All Your Stock Portfolios in One Place
We've created the ultimate portfolio companion for stock investors, and it's free.
• Connect an unlimited number of Portfolios and see your total in one currency
• Be alerted to new Warning Signs or Risks via email or mobile
• Track the Fair Value of your stocks
Have feedback on this article? Concerned about the content? Get in touch with us directly. Alternatively, email editorial-team (at) simplywallst.com.
This article by Simply Wall St is general in nature. We provide commentary based on historical data and analyst forecasts only using an unbiased methodology and our articles are not intended to be financial advice. It does not constitute a recommendation to buy or sell any stock, and does not take account of your objectives, or your financial situation. We aim to bring you long-term focused analysis driven by fundamental data. Note that our analysis may not factor in the latest price-sensitive company announcements or qualitative material. Simply Wall St has no position in any stocks mentioned.
About SZSE:000958
SPIC Industry-Finance Holdings
Engages in the generation and distribution of heat and electricity in China.
Flawless balance sheet with proven track record.
