Rastar Group's (SZSE:300043) 33% Dip Still Leaving Some Shareholders Feeling Restless Over Its P/SRatio

Rastar Group (SZSE:300043) shares have retraced a considerable 33% in the last month, reversing a fair amount of their solid recent performance. Indeed, the recent drop has reduced its annual gain to a relatively sedate 3.1% over the last twelve months.
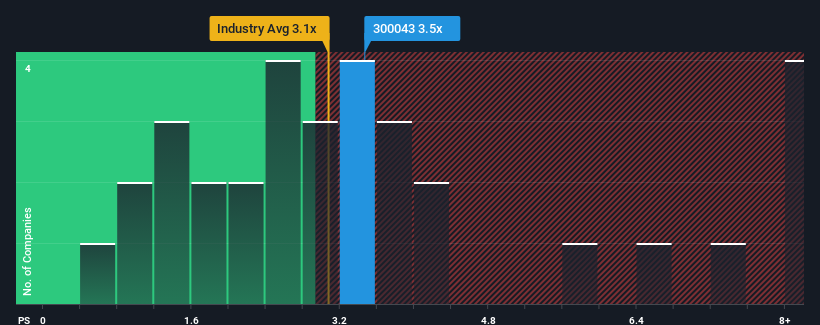
Even after such a large drop in price, there still wouldn't be many who think Rastar Group's price-to-sales (or "P/S") ratio of 3.5x is worth a mention when the median P/S in China's Leisure industry is similar at about 3.1x. However, investors might be overlooking a clear opportunity or potential setback if there is no rational basis for the P/S.
Check out our latest analysis for Rastar Group

What Does Rastar Group's P/S Mean For Shareholders?
For instance, Rastar Group's receding revenue in recent times would have to be some food for thought. It might be that many expect the company to put the disappointing revenue performance behind them over the coming period, which has kept the P/S from falling. If you like the company, you'd at least be hoping this is the case so that you could potentially pick up some stock while it's not quite in favour.
Although there are no analyst estimates available for Rastar Group, take a look at this free data-rich visualisation to see how the company stacks up on earnings, revenue and cash flow.How Is Rastar Group's Revenue Growth Trending?
Rastar Group's P/S ratio would be typical for a company that's only expected to deliver moderate growth, and importantly, perform in line with the industry.
Retrospectively, the last year delivered a frustrating 27% decrease to the company's top line. This means it has also seen a slide in revenue over the longer-term as revenue is down 3.7% in total over the last three years. Accordingly, shareholders would have felt downbeat about the medium-term rates of revenue growth.
In contrast to the company, the rest of the industry is expected to grow by 22% over the next year, which really puts the company's recent medium-term revenue decline into perspective.
With this information, we find it concerning that Rastar Group is trading at a fairly similar P/S compared to the industry. It seems most investors are ignoring the recent poor growth rate and are hoping for a turnaround in the company's business prospects. There's a good chance existing shareholders are setting themselves up for future disappointment if the P/S falls to levels more in line with the recent negative growth rates.
The Final Word
Following Rastar Group's share price tumble, its P/S is just clinging on to the industry median P/S. Using the price-to-sales ratio alone to determine if you should sell your stock isn't sensible, however it can be a practical guide to the company's future prospects.
Our look at Rastar Group revealed its shrinking revenues over the medium-term haven't impacted the P/S as much as we anticipated, given the industry is set to grow. Even though it matches the industry, we're uncomfortable with the current P/S ratio, as this dismal revenue performance is unlikely to support a more positive sentiment for long. Unless the recent medium-term conditions improve markedly, investors will have a hard time accepting the share price as fair value.
It's always necessary to consider the ever-present spectre of investment risk. We've identified 3 warning signs with Rastar Group, and understanding them should be part of your investment process.
If strong companies turning a profit tickle your fancy, then you'll want to check out this free list of interesting companies that trade on a low P/E (but have proven they can grow earnings).
New: AI Stock Screener & Alerts
Our new AI Stock Screener scans the market every day to uncover opportunities.
• Dividend Powerhouses (3%+ Yield)
• Undervalued Small Caps with Insider Buying
• High growth Tech and AI Companies
Or build your own from over 50 metrics.
Have feedback on this article? Concerned about the content? Get in touch with us directly. Alternatively, email editorial-team (at) simplywallst.com.
This article by Simply Wall St is general in nature. We provide commentary based on historical data and analyst forecasts only using an unbiased methodology and our articles are not intended to be financial advice. It does not constitute a recommendation to buy or sell any stock, and does not take account of your objectives, or your financial situation. We aim to bring you long-term focused analysis driven by fundamental data. Note that our analysis may not factor in the latest price-sensitive company announcements or qualitative material. Simply Wall St has no position in any stocks mentioned.
About SZSE:300043
Low with weak fundamentals.
Market Insights
Community Narratives


