
Advertisement
Shenzhen Ellassay FashionLtd's (SHSE:603808) earnings trajectory could turn positive as the stock swells 21% this past week

It's nice to see the Shenzhen Ellassay Fashion Co.,Ltd. (SHSE:603808) share price up 21% in a week. But that doesn't change the fact that the returns over the last five years have been less than pleasing. You would have done a lot better buying an index fund, since the stock has dropped 54% in that half decade.
Although the past week has been more reassuring for shareholders, they're still in the red over the last five years, so let's see if the underlying business has been responsible for the decline.
See our latest analysis for Shenzhen Ellassay FashionLtd
To quote Buffett, 'Ships will sail around the world but the Flat Earth Society will flourish. There will continue to be wide discrepancies between price and value in the marketplace...' One imperfect but simple way to consider how the market perception of a company has shifted is to compare the change in the earnings per share (EPS) with the share price movement.
Looking back five years, both Shenzhen Ellassay FashionLtd's share price and EPS declined; the latter at a rate of 34% per year. This fall in the EPS is worse than the 14% compound annual share price fall. The relatively muted share price reaction might be because the market expects the business to turn around. The high P/E ratio of 48.14 suggests that shareholders believe earnings will grow in the years ahead.
You can see below how EPS has changed over time (discover the exact values by clicking on the image).
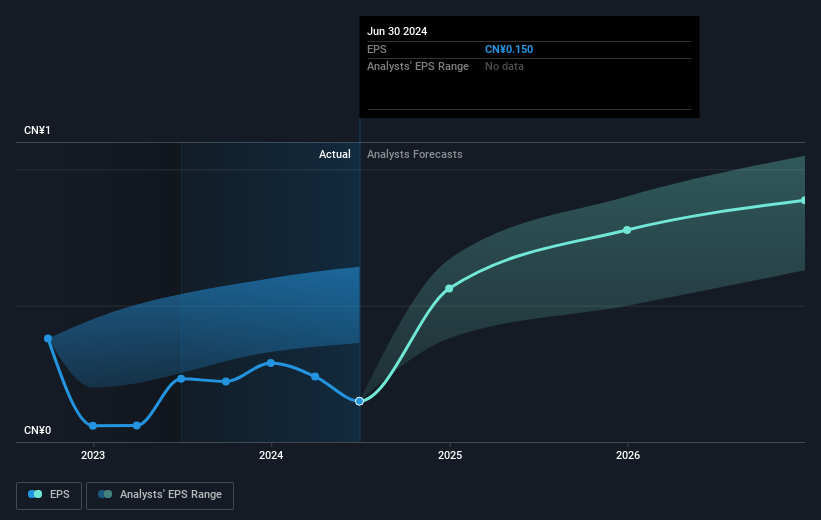
Dive deeper into Shenzhen Ellassay FashionLtd's key metrics by checking this interactive graph of Shenzhen Ellassay FashionLtd's earnings, revenue and cash flow.
What About Dividends?
When looking at investment returns, it is important to consider the difference between total shareholder return (TSR) and share price return. The TSR is a return calculation that accounts for the value of cash dividends (assuming that any dividend received was reinvested) and the calculated value of any discounted capital raisings and spin-offs. So for companies that pay a generous dividend, the TSR is often a lot higher than the share price return. We note that for Shenzhen Ellassay FashionLtd the TSR over the last 5 years was -49%, which is better than the share price return mentioned above. And there's no prize for guessing that the dividend payments largely explain the divergence!
A Different Perspective
While the broader market lost about 6.0% in the twelve months, Shenzhen Ellassay FashionLtd shareholders did even worse, losing 41% (even including dividends). Having said that, it's inevitable that some stocks will be oversold in a falling market. The key is to keep your eyes on the fundamental developments. Regrettably, last year's performance caps off a bad run, with the shareholders facing a total loss of 8% per year over five years. We realise that Baron Rothschild has said investors should "buy when there is blood on the streets", but we caution that investors should first be sure they are buying a high quality business. I find it very interesting to look at share price over the long term as a proxy for business performance. But to truly gain insight, we need to consider other information, too. To that end, you should be aware of the 3 warning signs we've spotted with Shenzhen Ellassay FashionLtd .
Of course Shenzhen Ellassay FashionLtd may not be the best stock to buy. So you may wish to see this free collection of growth stocks.
Please note, the market returns quoted in this article reflect the market weighted average returns of stocks that currently trade on Chinese exchanges.
New: Manage All Your Stock Portfolios in One Place
We've created the ultimate portfolio companion for stock investors, and it's free.
• Connect an unlimited number of Portfolios and see your total in one currency
• Be alerted to new Warning Signs or Risks via email or mobile
• Track the Fair Value of your stocks
Have feedback on this article? Concerned about the content? Get in touch with us directly. Alternatively, email editorial-team (at) simplywallst.com.
This article by Simply Wall St is general in nature. We provide commentary based on historical data and analyst forecasts only using an unbiased methodology and our articles are not intended to be financial advice. It does not constitute a recommendation to buy or sell any stock, and does not take account of your objectives, or your financial situation. We aim to bring you long-term focused analysis driven by fundamental data. Note that our analysis may not factor in the latest price-sensitive company announcements or qualitative material. Simply Wall St has no position in any stocks mentioned.
About SHSE:603808
Shenzhen Ellassay FashionLtd
Engages in the research and development, production, and sales of clothing products in China, Hong Kong, Macao, Taiwan, and internationally.
Flawless balance sheet, undervalued and pays a dividend.
Similar Companies
Market Insights


Advertisement
Community Narratives
Rocket Lab USA Will Ignite a 30% Revenue Growth Journey
Fair Value US$31.72|41.3% undervalued
KI
Community Contributor
EasyJet weirdly unloved by investors in spite of relatively attractive metrics
Fair Value UK£6.95|33.9% undervalued
PI
Community Contributor
HEXPOL AB: Sustained Long Term Growth, Stable Margins, and Strategic M&A
Fair Value SEK 122.27|27.0% undervalued
MA
Community Contributor