China National Gold Group Gold JewelleryLtd (SHSE:600916) Is Reinvesting To Multiply In Value


To find a multi-bagger stock, what are the underlying trends we should look for in a business? Ideally, a business will show two trends; firstly a growing return on capital employed (ROCE) and secondly, an increasing amount of capital employed. Ultimately, this demonstrates that it's a business that is reinvesting profits at increasing rates of return. With that in mind, the ROCE of China National Gold Group Gold JewelleryLtd (SHSE:600916) looks attractive right now, so lets see what the trend of returns can tell us.
Understanding Return On Capital Employed (ROCE)
Just to clarify if you're unsure, ROCE is a metric for evaluating how much pre-tax income (in percentage terms) a company earns on the capital invested in its business. To calculate this metric for China National Gold Group Gold JewelleryLtd, this is the formula:
Return on Capital Employed = Earnings Before Interest and Tax (EBIT) ÷ (Total Assets - Current Liabilities)
0.20 = CN¥1.6b ÷ (CN¥14b - CN¥5.5b) (Based on the trailing twelve months to March 2024).
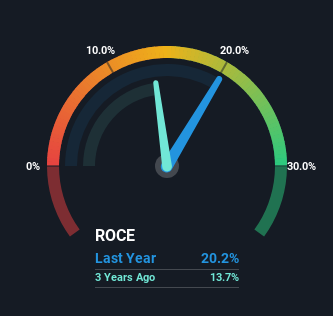
So, China National Gold Group Gold JewelleryLtd has an ROCE of 20%. In absolute terms that's a great return and it's even better than the Luxury industry average of 6.7%.
See our latest analysis for China National Gold Group Gold JewelleryLtd
In the above chart we have measured China National Gold Group Gold JewelleryLtd's prior ROCE against its prior performance, but the future is arguably more important. If you'd like, you can check out the forecasts from the analysts covering China National Gold Group Gold JewelleryLtd for free.
What Does the ROCE Trend For China National Gold Group Gold JewelleryLtd Tell Us?
We'd be pretty happy with returns on capital like China National Gold Group Gold JewelleryLtd. The company has consistently earned 20% for the last five years, and the capital employed within the business has risen 83% in that time. Returns like this are the envy of most businesses and given it has repeatedly reinvested at these rates, that's even better. If China National Gold Group Gold JewelleryLtd can keep this up, we'd be very optimistic about its future.
On a side note, China National Gold Group Gold JewelleryLtd's current liabilities are still rather high at 40% of total assets. This can bring about some risks because the company is basically operating with a rather large reliance on its suppliers or other sorts of short-term creditors. Ideally we'd like to see this reduce as that would mean fewer obligations bearing risks.
Our Take On China National Gold Group Gold JewelleryLtd's ROCE
In summary, we're delighted to see that China National Gold Group Gold JewelleryLtd has been compounding returns by reinvesting at consistently high rates of return, as these are common traits of a multi-bagger. However, despite the favorable fundamentals, the stock has fallen 34% over the last three years, so there might be an opportunity here for astute investors. For that reason, savvy investors might want to look further into this company in case it's a prime investment.
Like most companies, China National Gold Group Gold JewelleryLtd does come with some risks, and we've found 1 warning sign that you should be aware of.
If you'd like to see other companies earning high returns, check out our free list of companies earning high returns with solid balance sheets here.
New: AI Stock Screener & Alerts
Our new AI Stock Screener scans the market every day to uncover opportunities.
• Dividend Powerhouses (3%+ Yield)
• Undervalued Small Caps with Insider Buying
• High growth Tech and AI Companies
Or build your own from over 50 metrics.
Have feedback on this article? Concerned about the content? Get in touch with us directly. Alternatively, email editorial-team (at) simplywallst.com.
This article by Simply Wall St is general in nature. We provide commentary based on historical data and analyst forecasts only using an unbiased methodology and our articles are not intended to be financial advice. It does not constitute a recommendation to buy or sell any stock, and does not take account of your objectives, or your financial situation. We aim to bring you long-term focused analysis driven by fundamental data. Note that our analysis may not factor in the latest price-sensitive company announcements or qualitative material. Simply Wall St has no position in any stocks mentioned.
About SHSE:600916
China National Gold Group Gold JewelleryLtd
China National Gold Group Gold Jewellery Co.,Ltd.
Flawless balance sheet, undervalued and pays a dividend.
Market Insights

Community Narratives
