- China
- /
- Professional Services
- /
- SZSE:300746
Hanjia Design Group Co., Ltd.'s (SZSE:300746) 28% Dip In Price Shows Sentiment Is Matching Revenues


To the annoyance of some shareholders, Hanjia Design Group Co., Ltd. (SZSE:300746) shares are down a considerable 28% in the last month, which continues a horrid run for the company. The drop over the last 30 days has capped off a tough year for shareholders, with the share price down 33% in that time.
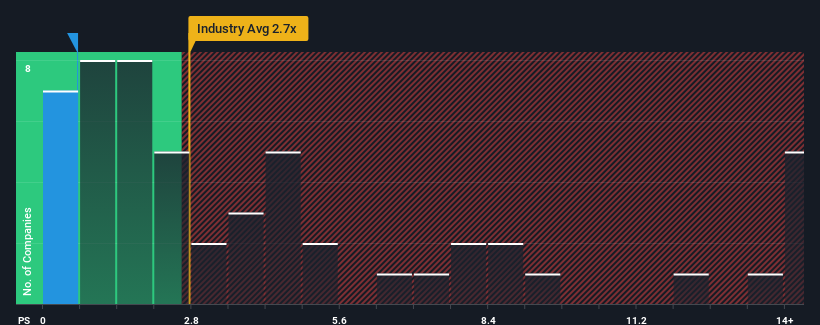
After such a large drop in price, Hanjia Design Group may be sending very bullish signals at the moment with its price-to-sales (or "P/S") ratio of 0.6x, since almost half of all companies in the Professional Services industry in China have P/S ratios greater than 2.7x and even P/S higher than 8x are not unusual. Although, it's not wise to just take the P/S at face value as there may be an explanation why it's so limited.
View our latest analysis for Hanjia Design Group
What Does Hanjia Design Group's P/S Mean For Shareholders?
For instance, Hanjia Design Group's receding revenue in recent times would have to be some food for thought. One possibility is that the P/S is low because investors think the company won't do enough to avoid underperforming the broader industry in the near future. If you like the company, you'd be hoping this isn't the case so that you could potentially pick up some stock while it's out of favour.
Although there are no analyst estimates available for Hanjia Design Group, take a look at this free data-rich visualisation to see how the company stacks up on earnings, revenue and cash flow.What Are Revenue Growth Metrics Telling Us About The Low P/S?
Hanjia Design Group's P/S ratio would be typical for a company that's expected to deliver very poor growth or even falling revenue, and importantly, perform much worse than the industry.
Taking a look back first, the company's revenue growth last year wasn't something to get excited about as it posted a disappointing decline of 6.7%. Regardless, revenue has managed to lift by a handy 28% in aggregate from three years ago, thanks to the earlier period of growth. Although it's been a bumpy ride, it's still fair to say the revenue growth recently has been mostly respectable for the company.
Comparing the recent medium-term revenue trends against the industry's one-year growth forecast of 94% shows it's noticeably less attractive.
With this in consideration, it's easy to understand why Hanjia Design Group's P/S falls short of the mark set by its industry peers. Apparently many shareholders weren't comfortable holding on to something they believe will continue to trail the wider industry.
The Final Word
Having almost fallen off a cliff, Hanjia Design Group's share price has pulled its P/S way down as well. Generally, our preference is to limit the use of the price-to-sales ratio to establishing what the market thinks about the overall health of a company.
In line with expectations, Hanjia Design Group maintains its low P/S on the weakness of its recent three-year growth being lower than the wider industry forecast. At this stage investors feel the potential for an improvement in revenue isn't great enough to justify a higher P/S ratio. If recent medium-term revenue trends continue, it's hard to see the share price experience a reversal of fortunes anytime soon.
You need to take note of risks, for example - Hanjia Design Group has 3 warning signs (and 2 which are a bit concerning) we think you should know about.
If strong companies turning a profit tickle your fancy, then you'll want to check out this free list of interesting companies that trade on a low P/E (but have proven they can grow earnings).
Valuation is complex, but we're here to simplify it.
Discover if Hanjia Design Group might be undervalued or overvalued with our detailed analysis, featuring fair value estimates, potential risks, dividends, insider trades, and its financial condition.
Access Free AnalysisHave feedback on this article? Concerned about the content? Get in touch with us directly. Alternatively, email editorial-team (at) simplywallst.com.
This article by Simply Wall St is general in nature. We provide commentary based on historical data and analyst forecasts only using an unbiased methodology and our articles are not intended to be financial advice. It does not constitute a recommendation to buy or sell any stock, and does not take account of your objectives, or your financial situation. We aim to bring you long-term focused analysis driven by fundamental data. Note that our analysis may not factor in the latest price-sensitive company announcements or qualitative material. Simply Wall St has no position in any stocks mentioned.
About SZSE:300746
Hanjia Design Group
Primarily engages in the provision of various design services in China.
Flawless balance sheet and slightly overvalued.
