- China
- /
- Professional Services
- /
- SZSE:300500
Tus-Design Group Co., Ltd. (SZSE:300500) Surges 39% Yet Its Low P/S Is No Reason For Excitement


Tus-Design Group Co., Ltd. (SZSE:300500) shares have had a really impressive month, gaining 39% after a shaky period beforehand. Not all shareholders will be feeling jubilant, since the share price is still down a very disappointing 34% in the last twelve months.
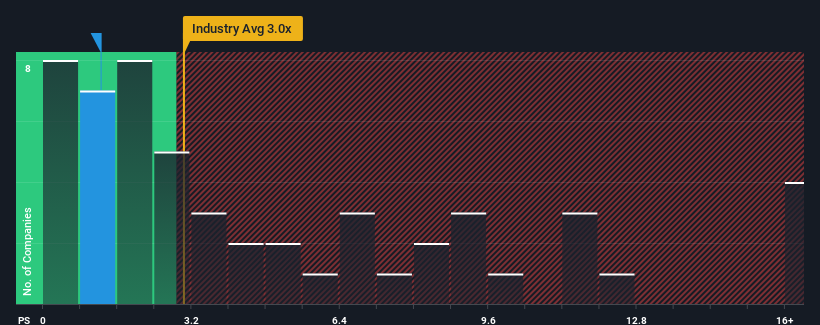
Even after such a large jump in price, Tus-Design Group may still be sending buy signals at present with its price-to-sales (or "P/S") ratio of 1.2x, considering almost half of all companies in the Professional Services industry in China have P/S ratios greater than 3x and even P/S higher than 9x aren't out of the ordinary. Nonetheless, we'd need to dig a little deeper to determine if there is a rational basis for the reduced P/S.
Check out our latest analysis for Tus-Design Group
What Does Tus-Design Group's Recent Performance Look Like?
As an illustration, revenue has deteriorated at Tus-Design Group over the last year, which is not ideal at all. It might be that many expect the disappointing revenue performance to continue or accelerate, which has repressed the P/S. However, if this doesn't eventuate then existing shareholders may be feeling optimistic about the future direction of the share price.
Want the full picture on earnings, revenue and cash flow for the company? Then our free report on Tus-Design Group will help you shine a light on its historical performance.How Is Tus-Design Group's Revenue Growth Trending?
The only time you'd be truly comfortable seeing a P/S as low as Tus-Design Group's is when the company's growth is on track to lag the industry.
In reviewing the last year of financials, we were disheartened to see the company's revenues fell to the tune of 16%. The last three years don't look nice either as the company has shrunk revenue by 19% in aggregate. So unfortunately, we have to acknowledge that the company has not done a great job of growing revenue over that time.
Comparing that to the industry, which is predicted to deliver 136% growth in the next 12 months, the company's downward momentum based on recent medium-term revenue results is a sobering picture.
With this in mind, we understand why Tus-Design Group's P/S is lower than most of its industry peers. However, we think shrinking revenues are unlikely to lead to a stable P/S over the longer term, which could set up shareholders for future disappointment. There's potential for the P/S to fall to even lower levels if the company doesn't improve its top-line growth.
The Final Word
The latest share price surge wasn't enough to lift Tus-Design Group's P/S close to the industry median. Generally, our preference is to limit the use of the price-to-sales ratio to establishing what the market thinks about the overall health of a company.
Our examination of Tus-Design Group confirms that the company's shrinking revenue over the past medium-term is a key factor in its low price-to-sales ratio, given the industry is projected to grow. At this stage investors feel the potential for an improvement in revenue isn't great enough to justify a higher P/S ratio. If recent medium-term revenue trends continue, it's hard to see the share price moving strongly in either direction in the near future under these circumstances.
We don't want to rain on the parade too much, but we did also find 2 warning signs for Tus-Design Group that you need to be mindful of.
If strong companies turning a profit tickle your fancy, then you'll want to check out this free list of interesting companies that trade on a low P/E (but have proven they can grow earnings).
Valuation is complex, but we're here to simplify it.
Discover if Tus-Design Group might be undervalued or overvalued with our detailed analysis, featuring fair value estimates, potential risks, dividends, insider trades, and its financial condition.
Access Free AnalysisHave feedback on this article? Concerned about the content? Get in touch with us directly. Alternatively, email editorial-team (at) simplywallst.com.
This article by Simply Wall St is general in nature. We provide commentary based on historical data and analyst forecasts only using an unbiased methodology and our articles are not intended to be financial advice. It does not constitute a recommendation to buy or sell any stock, and does not take account of your objectives, or your financial situation. We aim to bring you long-term focused analysis driven by fundamental data. Note that our analysis may not factor in the latest price-sensitive company announcements or qualitative material. Simply Wall St has no position in any stocks mentioned.
About SZSE:300500
Good value with adequate balance sheet.
Market Insights

Community Narratives

