- China
- /
- Professional Services
- /
- SZSE:002789
Shenzhen Jianyi Decoration Group Co., Ltd. (SZSE:002789) Shares Fly 29% But Investors Aren't Buying For Growth


Shenzhen Jianyi Decoration Group Co., Ltd. (SZSE:002789) shareholders would be excited to see that the share price has had a great month, posting a 29% gain and recovering from prior weakness. Not all shareholders will be feeling jubilant, since the share price is still down a very disappointing 29% in the last twelve months.
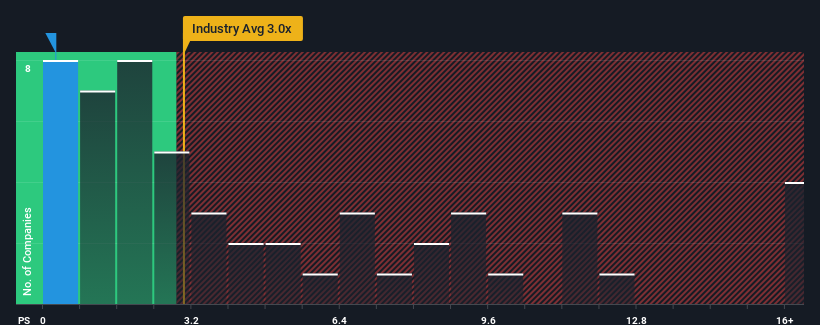
Although its price has surged higher, Shenzhen Jianyi Decoration Group may still be sending very bullish signals at the moment with its price-to-sales (or "P/S") ratio of 0.3x, since almost half of all companies in the Professional Services industry in China have P/S ratios greater than 3x and even P/S higher than 9x are not unusual. Although, it's not wise to just take the P/S at face value as there may be an explanation why it's so limited.
See our latest analysis for Shenzhen Jianyi Decoration Group
What Does Shenzhen Jianyi Decoration Group's Recent Performance Look Like?
Shenzhen Jianyi Decoration Group certainly has been doing a great job lately as it's been growing its revenue at a really rapid pace. One possibility is that the P/S ratio is low because investors think this strong revenue growth might actually underperform the broader industry in the near future. If that doesn't eventuate, then existing shareholders have reason to be quite optimistic about the future direction of the share price.
We don't have analyst forecasts, but you can see how recent trends are setting up the company for the future by checking out our free report on Shenzhen Jianyi Decoration Group's earnings, revenue and cash flow.Do Revenue Forecasts Match The Low P/S Ratio?
There's an inherent assumption that a company should far underperform the industry for P/S ratios like Shenzhen Jianyi Decoration Group's to be considered reasonable.
Retrospectively, the last year delivered an exceptional 142% gain to the company's top line. Pleasingly, revenue has also lifted 150% in aggregate from three years ago, thanks to the last 12 months of growth. Accordingly, shareholders would have definitely welcomed those medium-term rates of revenue growth.
Comparing the recent medium-term revenue trends against the industry's one-year growth forecast of 136% shows it's noticeably less attractive.
With this information, we can see why Shenzhen Jianyi Decoration Group is trading at a P/S lower than the industry. Apparently many shareholders weren't comfortable holding on to something they believe will continue to trail the wider industry.
The Final Word
Shenzhen Jianyi Decoration Group's recent share price jump still sees fails to bring its P/S alongside the industry median. It's argued the price-to-sales ratio is an inferior measure of value within certain industries, but it can be a powerful business sentiment indicator.
Our examination of Shenzhen Jianyi Decoration Group confirms that the company's revenue trends over the past three-year years are a key factor in its low price-to-sales ratio, as we suspected, given they fall short of current industry expectations. At this stage investors feel the potential for an improvement in revenue isn't great enough to justify a higher P/S ratio. If recent medium-term revenue trends continue, it's hard to see the share price experience a reversal of fortunes anytime soon.
You need to take note of risks, for example - Shenzhen Jianyi Decoration Group has 3 warning signs (and 2 which make us uncomfortable) we think you should know about.
If these risks are making you reconsider your opinion on Shenzhen Jianyi Decoration Group, explore our interactive list of high quality stocks to get an idea of what else is out there.
If you're looking to trade Shenzhen Jianyi Decoration Group, open an account with the lowest-cost platform trusted by professionals, Interactive Brokers.
With clients in over 200 countries and territories, and access to 160 markets, IBKR lets you trade stocks, options, futures, forex, bonds and funds from a single integrated account.
Enjoy no hidden fees, no account minimums, and FX conversion rates as low as 0.03%, far better than what most brokers offer.
Sponsored ContentNew: Manage All Your Stock Portfolios in One Place
We've created the ultimate portfolio companion for stock investors, and it's free.
• Connect an unlimited number of Portfolios and see your total in one currency
• Be alerted to new Warning Signs or Risks via email or mobile
• Track the Fair Value of your stocks
Have feedback on this article? Concerned about the content? Get in touch with us directly. Alternatively, email editorial-team (at) simplywallst.com.
This article by Simply Wall St is general in nature. We provide commentary based on historical data and analyst forecasts only using an unbiased methodology and our articles are not intended to be financial advice. It does not constitute a recommendation to buy or sell any stock, and does not take account of your objectives, or your financial situation. We aim to bring you long-term focused analysis driven by fundamental data. Note that our analysis may not factor in the latest price-sensitive company announcements or qualitative material. Simply Wall St has no position in any stocks mentioned.
About SZSE:002789
Shenzhen Jianyi Decoration Group
Shenzhen Jianyi Decoration Group Co., Ltd.
Good value low.
Market Insights

Community Narratives


