- China
- /
- Professional Services
- /
- SHSE:688509
Zhengyuan Geomatics Group Co.,Ltd.'s (SHSE:688509) Shares Climb 30% But Its Business Is Yet to Catch Up

Zhengyuan Geomatics Group Co.,Ltd. (SHSE:688509) shareholders have had their patience rewarded with a 30% share price jump in the last month. Unfortunately, the gains of the last month did little to right the losses of the last year with the stock still down 22% over that time.
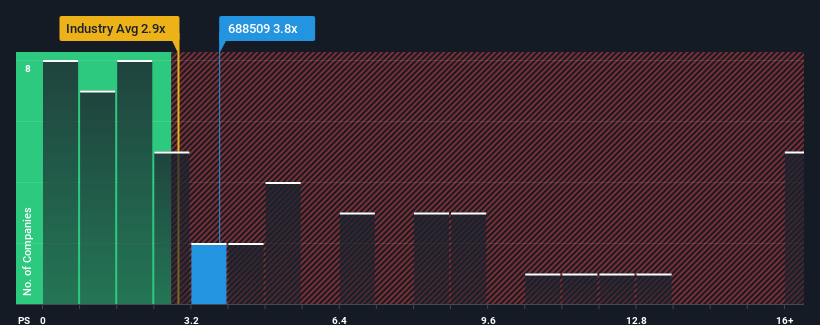
Following the firm bounce in price, you could be forgiven for thinking Zhengyuan Geomatics GroupLtd is a stock not worth researching with a price-to-sales ratios (or "P/S") of 3.8x, considering almost half the companies in China's Professional Services industry have P/S ratios below 2.9x. Although, it's not wise to just take the P/S at face value as there may be an explanation why it's as high as it is.
See our latest analysis for Zhengyuan Geomatics GroupLtd
How Has Zhengyuan Geomatics GroupLtd Performed Recently?
As an illustration, revenue has deteriorated at Zhengyuan Geomatics GroupLtd over the last year, which is not ideal at all. One possibility is that the P/S is high because investors think the company will still do enough to outperform the broader industry in the near future. You'd really hope so, otherwise you're paying a pretty hefty price for no particular reason.
We don't have analyst forecasts, but you can see how recent trends are setting up the company for the future by checking out our free report on Zhengyuan Geomatics GroupLtd's earnings, revenue and cash flow.How Is Zhengyuan Geomatics GroupLtd's Revenue Growth Trending?
There's an inherent assumption that a company should outperform the industry for P/S ratios like Zhengyuan Geomatics GroupLtd's to be considered reasonable.
Retrospectively, the last year delivered a frustrating 34% decrease to the company's top line. The last three years don't look nice either as the company has shrunk revenue by 57% in aggregate. So unfortunately, we have to acknowledge that the company has not done a great job of growing revenue over that time.
Comparing that to the industry, which is predicted to deliver 32% growth in the next 12 months, the company's downward momentum based on recent medium-term revenue results is a sobering picture.
In light of this, it's alarming that Zhengyuan Geomatics GroupLtd's P/S sits above the majority of other companies. Apparently many investors in the company are way more bullish than recent times would indicate and aren't willing to let go of their stock at any price. Only the boldest would assume these prices are sustainable as a continuation of recent revenue trends is likely to weigh heavily on the share price eventually.
The Key Takeaway
The large bounce in Zhengyuan Geomatics GroupLtd's shares has lifted the company's P/S handsomely. Using the price-to-sales ratio alone to determine if you should sell your stock isn't sensible, however it can be a practical guide to the company's future prospects.
We've established that Zhengyuan Geomatics GroupLtd currently trades on a much higher than expected P/S since its recent revenues have been in decline over the medium-term. When we see revenue heading backwards and underperforming the industry forecasts, we feel the possibility of the share price declining is very real, bringing the P/S back into the realm of reasonability. If recent medium-term revenue trends continue, it will place shareholders' investments at significant risk and potential investors in danger of paying an excessive premium.
You always need to take note of risks, for example - Zhengyuan Geomatics GroupLtd has 1 warning sign we think you should be aware of.
Of course, profitable companies with a history of great earnings growth are generally safer bets. So you may wish to see this free collection of other companies that have reasonable P/E ratios and have grown earnings strongly.
Mobile Infrastructure for Defense and Disaster
The next wave in robotics isn't humanoid. Its fully autonomous towers delivering 5G, ISR, and radar in under 30 minutes, anywhere.
Get the investor briefing before the next round of contracts
Sponsored On Behalf of CiTechValuation is complex, but we're here to simplify it.
Discover if Zhengyuan Geomatics GroupLtd might be undervalued or overvalued with our detailed analysis, featuring fair value estimates, potential risks, dividends, insider trades, and its financial condition.
Access Free AnalysisHave feedback on this article? Concerned about the content? Get in touch with us directly. Alternatively, email editorial-team (at) simplywallst.com.
This article by Simply Wall St is general in nature. We provide commentary based on historical data and analyst forecasts only using an unbiased methodology and our articles are not intended to be financial advice. It does not constitute a recommendation to buy or sell any stock, and does not take account of your objectives, or your financial situation. We aim to bring you long-term focused analysis driven by fundamental data. Note that our analysis may not factor in the latest price-sensitive company announcements or qualitative material. Simply Wall St has no position in any stocks mentioned.
About SHSE:688509
Zhengyuan Geomatics GroupLtd
Engages in the research, development, and application of surveying and mapping geographical information technology services in China.
Imperfect balance sheet with very low risk.
Market Insights

Weekly Picks

THE KINGDOM OF BROWN GOODS: WHY MGPI IS BEING CRUSHED BY INVENTORY & PRIMED FOR RESURRECTION


Why Vertical Aerospace (NYSE: EVTL) is Worth Possibly Over 13x its Current Price


The Quiet Giant That Became AI’s Power Grid
Recently Updated Narratives
Why Vertical Aerospace (NYSE: EVTL) is Worth Possibly Over 13x its Current Price

Deep Value Multi Bagger Opportunity


A case for CA$31.80 (undiluted), aka 8,616% upside from CA$0.37 (an 86 bagger!).
Popular Narratives


MicroVision will explode future revenue by 380.37% with a vision towards success


Crazy Undervalued 42 Baggers Silver Play (Active & Running Mine)


NVDA: Expanding AI Demand Will Drive Major Data Center Investments Through 2026
Trending Discussion


Thanks for sharing these. They really help when I pick what dividend stocks to invest in
