- China
- /
- Professional Services
- /
- SHSE:600861
Earnings grew faster than the respectable 13% CAGR delivered to FESCO Group (SHSE:600861) shareholders over the last five years

It might be of some concern to shareholders to see the FESCO Group Co., Ltd. (SHSE:600861) share price down 15% in the last month. On the bright side the returns have been quite good over the last half decade. It has returned a market beating 79% in that time. Unfortunately not all shareholders will have held it for five years, so spare a thought for those caught in the 35% decline over the last three years: that's a long time to wait for profits.
Although FESCO Group has shed CN¥1.3b from its market cap this week, let's take a look at its longer term fundamental trends and see if they've driven returns.
See our latest analysis for FESCO Group
While the efficient markets hypothesis continues to be taught by some, it has been proven that markets are over-reactive dynamic systems, and investors are not always rational. One imperfect but simple way to consider how the market perception of a company has shifted is to compare the change in the earnings per share (EPS) with the share price movement.
During the last half decade, FESCO Group became profitable. That's generally thought to be a genuine positive, so investors may expect to see an increasing share price.
The graphic below depicts how EPS has changed over time (unveil the exact values by clicking on the image).
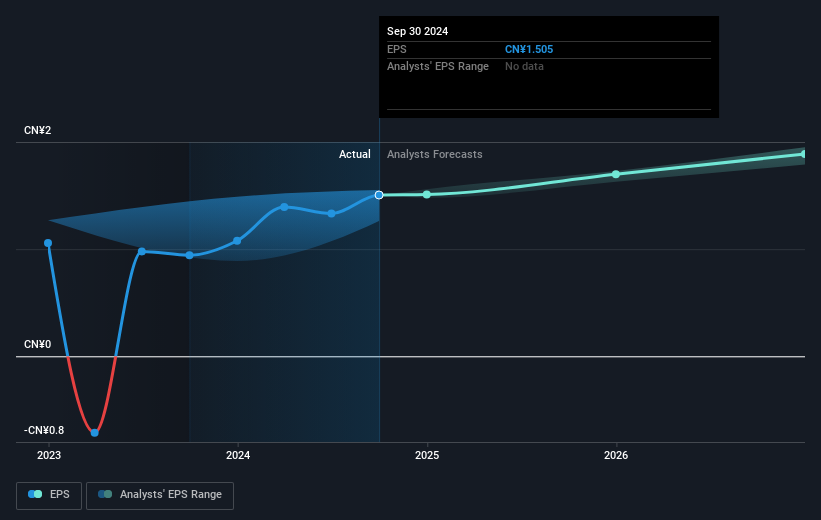
It is of course excellent to see how FESCO Group has grown profits over the years, but the future is more important for shareholders. You can see how its balance sheet has strengthened (or weakened) over time in this free interactive graphic.
What About Dividends?
It is important to consider the total shareholder return, as well as the share price return, for any given stock. Whereas the share price return only reflects the change in the share price, the TSR includes the value of dividends (assuming they were reinvested) and the benefit of any discounted capital raising or spin-off. It's fair to say that the TSR gives a more complete picture for stocks that pay a dividend. As it happens, FESCO Group's TSR for the last 5 years was 85%, which exceeds the share price return mentioned earlier. And there's no prize for guessing that the dividend payments largely explain the divergence!
A Different Perspective
FESCO Group shareholders are down 5.4% for the year (even including dividends), but the market itself is up 9.2%. However, keep in mind that even the best stocks will sometimes underperform the market over a twelve month period. Longer term investors wouldn't be so upset, since they would have made 13%, each year, over five years. If the fundamental data continues to indicate long term sustainable growth, the current sell-off could be an opportunity worth considering. It's always interesting to track share price performance over the longer term. But to understand FESCO Group better, we need to consider many other factors. Consider for instance, the ever-present spectre of investment risk. We've identified 1 warning sign with FESCO Group , and understanding them should be part of your investment process.
If you are like me, then you will not want to miss this free list of undervalued small caps that insiders are buying.
Please note, the market returns quoted in this article reflect the market weighted average returns of stocks that currently trade on Chinese exchanges.
New: AI Stock Screener & Alerts
Our new AI Stock Screener scans the market every day to uncover opportunities.
• Dividend Powerhouses (3%+ Yield)
• Undervalued Small Caps with Insider Buying
• High growth Tech and AI Companies
Or build your own from over 50 metrics.
Have feedback on this article? Concerned about the content? Get in touch with us directly. Alternatively, email editorial-team (at) simplywallst.com.
This article by Simply Wall St is general in nature. We provide commentary based on historical data and analyst forecasts only using an unbiased methodology and our articles are not intended to be financial advice. It does not constitute a recommendation to buy or sell any stock, and does not take account of your objectives, or your financial situation. We aim to bring you long-term focused analysis driven by fundamental data. Note that our analysis may not factor in the latest price-sensitive company announcements or qualitative material. Simply Wall St has no position in any stocks mentioned.
About SHSE:600861
Very undervalued with flawless balance sheet and pays a dividend.
Similar Companies
Market Insights

Community Narratives


