
Advertisement
- China
- /
- Construction
- /
- SZSE:300506
Some Shenzhen Minkave Technology Co., Ltd. (SZSE:300506) Shareholders Look For Exit As Shares Take 70% Pounding

Shenzhen Minkave Technology Co., Ltd. (SZSE:300506) shareholders that were waiting for something to happen have been dealt a blow with a 70% share price drop in the last month. For any long-term shareholders, the last month ends a year to forget by locking in a 75% share price decline.
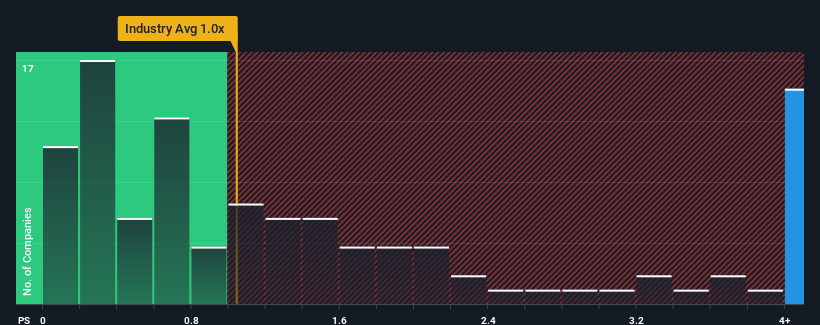
In spite of the heavy fall in price, when almost half of the companies in China's Construction industry have price-to-sales ratios (or "P/S") below 1x, you may still consider Shenzhen Minkave Technology as a stock not worth researching with its 14.1x P/S ratio. Although, it's not wise to just take the P/S at face value as there may be an explanation why it's so lofty.
See our latest analysis for Shenzhen Minkave Technology
What Does Shenzhen Minkave Technology's Recent Performance Look Like?
Shenzhen Minkave Technology certainly has been doing a great job lately as it's been growing its revenue at a really rapid pace. It seems that many are expecting the strong revenue performance to beat most other companies over the coming period, which has increased investors’ willingness to pay up for the stock. You'd really hope so, otherwise you're paying a pretty hefty price for no particular reason.
We don't have analyst forecasts, but you can see how recent trends are setting up the company for the future by checking out our free report on Shenzhen Minkave Technology's earnings, revenue and cash flow.What Are Revenue Growth Metrics Telling Us About The High P/S?
Shenzhen Minkave Technology's P/S ratio would be typical for a company that's expected to deliver very strong growth, and importantly, perform much better than the industry.
Taking a look back first, we see that the company grew revenue by an impressive 240% last year. Still, revenue has fallen 90% in total from three years ago, which is quite disappointing. So unfortunately, we have to acknowledge that the company has not done a great job of growing revenues over that time.
Comparing that to the industry, which is predicted to deliver 13% growth in the next 12 months, the company's downward momentum based on recent medium-term revenue results is a sobering picture.
In light of this, it's alarming that Shenzhen Minkave Technology's P/S sits above the majority of other companies. It seems most investors are ignoring the recent poor growth rate and are hoping for a turnaround in the company's business prospects. There's a very good chance existing shareholders are setting themselves up for future disappointment if the P/S falls to levels more in line with the recent negative growth rates.
What Does Shenzhen Minkave Technology's P/S Mean For Investors?
Shenzhen Minkave Technology's shares may have suffered, but its P/S remains high. While the price-to-sales ratio shouldn't be the defining factor in whether you buy a stock or not, it's quite a capable barometer of revenue expectations.
We've established that Shenzhen Minkave Technology currently trades on a much higher than expected P/S since its recent revenues have been in decline over the medium-term. With a revenue decline on investors' minds, the likelihood of a souring sentiment is quite high which could send the P/S back in line with what we'd expect. If recent medium-term revenue trends continue, it will place shareholders' investments at significant risk and potential investors in danger of paying an excessive premium.
Plus, you should also learn about these 2 warning signs we've spotted with Shenzhen Minkave Technology.
Of course, profitable companies with a history of great earnings growth are generally safer bets. So you may wish to see this free collection of other companies that have reasonable P/E ratios and have grown earnings strongly.
New: Manage All Your Stock Portfolios in One Place
We've created the ultimate portfolio companion for stock investors, and it's free.
• Connect an unlimited number of Portfolios and see your total in one currency
• Be alerted to new Warning Signs or Risks via email or mobile
• Track the Fair Value of your stocks
Have feedback on this article? Concerned about the content? Get in touch with us directly. Alternatively, email editorial-team (at) simplywallst.com.
This article by Simply Wall St is general in nature. We provide commentary based on historical data and analyst forecasts only using an unbiased methodology and our articles are not intended to be financial advice. It does not constitute a recommendation to buy or sell any stock, and does not take account of your objectives, or your financial situation. We aim to bring you long-term focused analysis driven by fundamental data. Note that our analysis may not factor in the latest price-sensitive company announcements or qualitative material. Simply Wall St has no position in any stocks mentioned.
About SZSE:300506
Shenzhen Minkave Technology
Engages in landscape lighting engineering business in China.
Low with imperfect balance sheet.
Market Insights

Advertisement
Community Narratives
Pinterest will surge as advertising innovations ignite revenue growth
Fair Value US$42.63|26.1% undervalued
BR
Community Contributor
Brambles' Revenue Set to Climb 14% with Profit Margins Following
Fair Value AU$21.90|4.8% overvalued
RO
Community Contributor
Challenging Future for STG as Organic Sales Decline by 8.8%
Fair Value DKK 116.13|27.0% undervalued
KA
Community Contributor