Guangzhou Haozhi Industrial Co.,Ltd. (SZSE:300503) May Have Run Too Fast Too Soon With Recent 31% Price Plummet


Guangzhou Haozhi Industrial Co.,Ltd. (SZSE:300503) shares have had a horrible month, losing 31% after a relatively good period beforehand. Longer-term, the stock has been solid despite a difficult 30 days, gaining 17% in the last year.
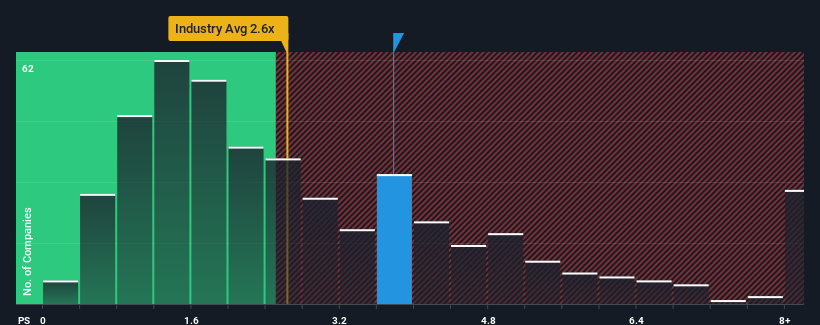
In spite of the heavy fall in price, when almost half of the companies in China's Machinery industry have price-to-sales ratios (or "P/S") below 2.6x, you may still consider Guangzhou Haozhi IndustrialLtd as a stock probably not worth researching with its 3.8x P/S ratio. However, the P/S might be high for a reason and it requires further investigation to determine if it's justified.
View our latest analysis for Guangzhou Haozhi IndustrialLtd
How Has Guangzhou Haozhi IndustrialLtd Performed Recently?
The recent revenue growth at Guangzhou Haozhi IndustrialLtd would have to be considered satisfactory if not spectacular. One possibility is that the P/S ratio is high because investors think this good revenue growth will be enough to outperform the broader industry in the near future. However, if this isn't the case, investors might get caught out paying too much for the stock.
Want the full picture on earnings, revenue and cash flow for the company? Then our free report on Guangzhou Haozhi IndustrialLtd will help you shine a light on its historical performance.What Are Revenue Growth Metrics Telling Us About The High P/S?
Guangzhou Haozhi IndustrialLtd's P/S ratio would be typical for a company that's expected to deliver solid growth, and importantly, perform better than the industry.
Taking a look back first, we see that the company managed to grow revenues by a handy 2.9% last year. The solid recent performance means it was also able to grow revenue by 26% in total over the last three years. Accordingly, shareholders would have probably been satisfied with the medium-term rates of revenue growth.
Comparing that to the industry, which is predicted to deliver 24% growth in the next 12 months, the company's momentum is weaker, based on recent medium-term annualised revenue results.
With this information, we find it concerning that Guangzhou Haozhi IndustrialLtd is trading at a P/S higher than the industry. Apparently many investors in the company are way more bullish than recent times would indicate and aren't willing to let go of their stock at any price. There's a good chance existing shareholders are setting themselves up for future disappointment if the P/S falls to levels more in line with recent growth rates.
What We Can Learn From Guangzhou Haozhi IndustrialLtd's P/S?
Guangzhou Haozhi IndustrialLtd's P/S remain high even after its stock plunged. Typically, we'd caution against reading too much into price-to-sales ratios when settling on investment decisions, though it can reveal plenty about what other market participants think about the company.
The fact that Guangzhou Haozhi IndustrialLtd currently trades on a higher P/S relative to the industry is an oddity, since its recent three-year growth is lower than the wider industry forecast. Right now we aren't comfortable with the high P/S as this revenue performance isn't likely to support such positive sentiment for long. If recent medium-term revenue trends continue, it will place shareholders' investments at significant risk and potential investors in danger of paying an excessive premium.
Before you settle on your opinion, we've discovered 1 warning sign for Guangzhou Haozhi IndustrialLtd that you should be aware of.
Of course, profitable companies with a history of great earnings growth are generally safer bets. So you may wish to see this free collection of other companies that have reasonable P/E ratios and have grown earnings strongly.
New: Manage All Your Stock Portfolios in One Place
We've created the ultimate portfolio companion for stock investors, and it's free.
• Connect an unlimited number of Portfolios and see your total in one currency
• Be alerted to new Warning Signs or Risks via email or mobile
• Track the Fair Value of your stocks
Have feedback on this article? Concerned about the content? Get in touch with us directly. Alternatively, email editorial-team (at) simplywallst.com.
This article by Simply Wall St is general in nature. We provide commentary based on historical data and analyst forecasts only using an unbiased methodology and our articles are not intended to be financial advice. It does not constitute a recommendation to buy or sell any stock, and does not take account of your objectives, or your financial situation. We aim to bring you long-term focused analysis driven by fundamental data. Note that our analysis may not factor in the latest price-sensitive company announcements or qualitative material. Simply Wall St has no position in any stocks mentioned.
About SZSE:300503
Guangzhou Haozhi IndustrialLtd
Researches and develops, designs, manufactures, sells, and repairs precision electro-spindles and related spare parts in China and internationally.
Low with questionable track record.
Market Insights

Community Narratives


