
Advertisement
Calculating The Fair Value Of Shannon Semiconductor Technology Co.,Ltd. (SZSE:300475)

Key Insights
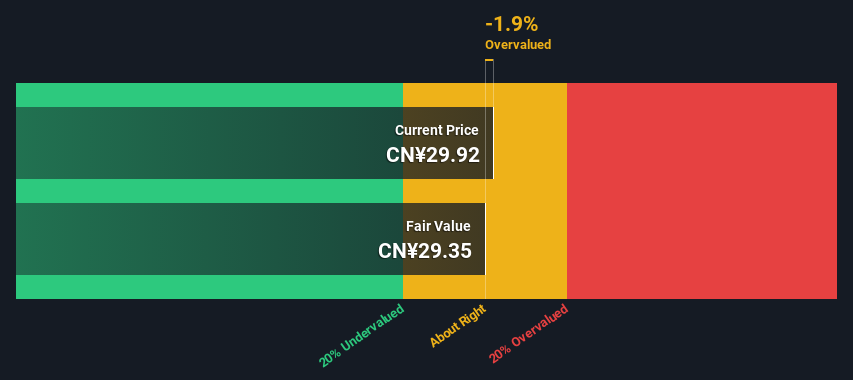
- Shannon Semiconductor TechnologyLtd's estimated fair value is CN¥29.35 based on 2 Stage Free Cash Flow to Equity
- With CN¥29.92 share price, Shannon Semiconductor TechnologyLtd appears to be trading close to its estimated fair value
- When compared to theindustry average discount of -290%, Shannon Semiconductor TechnologyLtd's competitors seem to be trading at a greater premium to fair value
Today we will run through one way of estimating the intrinsic value of Shannon Semiconductor Technology Co.,Ltd. (SZSE:300475) by projecting its future cash flows and then discounting them to today's value. This will be done using the Discounted Cash Flow (DCF) model. Before you think you won't be able to understand it, just read on! It's actually much less complex than you'd imagine.
Remember though, that there are many ways to estimate a company's value, and a DCF is just one method. If you still have some burning questions about this type of valuation, take a look at the Simply Wall St analysis model.
View our latest analysis for Shannon Semiconductor TechnologyLtd
What's The Estimated Valuation?
We're using the 2-stage growth model, which simply means we take in account two stages of company's growth. In the initial period the company may have a higher growth rate and the second stage is usually assumed to have a stable growth rate. To start off with, we need to estimate the next ten years of cash flows. Seeing as no analyst estimates of free cash flow are available to us, we have extrapolate the previous free cash flow (FCF) from the company's last reported value. We assume companies with shrinking free cash flow will slow their rate of shrinkage, and that companies with growing free cash flow will see their growth rate slow, over this period. We do this to reflect that growth tends to slow more in the early years than it does in later years.
A DCF is all about the idea that a dollar in the future is less valuable than a dollar today, and so the sum of these future cash flows is then discounted to today's value:
10-year free cash flow (FCF) estimate
| 2025 | 2026 | 2027 | 2028 | 2029 | 2030 | 2031 | 2032 | 2033 | 2034 | |
| Levered FCF (CN¥, Millions) | CN¥418.5m | CN¥539.6m | CN¥653.6m | CN¥755.9m | CN¥845.3m | CN¥922.6m | CN¥989.7m | CN¥1.05b | CN¥1.10b | CN¥1.15b |
| Growth Rate Estimate Source | Est @ 40.08% | Est @ 28.93% | Est @ 21.12% | Est @ 15.65% | Est @ 11.83% | Est @ 9.15% | Est @ 7.27% | Est @ 5.96% | Est @ 5.04% | Est @ 4.40% |
| Present Value (CN¥, Millions) Discounted @ 8.9% | CN¥384 | CN¥455 | CN¥506 | CN¥537 | CN¥551 | CN¥553 | CN¥544 | CN¥530 | CN¥511 | CN¥490 |
("Est" = FCF growth rate estimated by Simply Wall St)
Present Value of 10-year Cash Flow (PVCF) = CN¥5.1b
The second stage is also known as Terminal Value, this is the business's cash flow after the first stage. The Gordon Growth formula is used to calculate Terminal Value at a future annual growth rate equal to the 5-year average of the 10-year government bond yield of 2.9%. We discount the terminal cash flows to today's value at a cost of equity of 8.9%.
Terminal Value (TV)= FCF2034 × (1 + g) ÷ (r – g) = CN¥1.2b× (1 + 2.9%) ÷ (8.9%– 2.9%) = CN¥20b
Present Value of Terminal Value (PVTV)= TV / (1 + r)10= CN¥20b÷ ( 1 + 8.9%)10= CN¥8.4b
The total value, or equity value, is then the sum of the present value of the future cash flows, which in this case is CN¥13b. The last step is to then divide the equity value by the number of shares outstanding. Relative to the current share price of CN¥29.9, the company appears around fair value at the time of writing. Remember though, that this is just an approximate valuation, and like any complex formula - garbage in, garbage out.
Important Assumptions
We would point out that the most important inputs to a discounted cash flow are the discount rate and of course the actual cash flows. If you don't agree with these result, have a go at the calculation yourself and play with the assumptions. The DCF also does not consider the possible cyclicality of an industry, or a company's future capital requirements, so it does not give a full picture of a company's potential performance. Given that we are looking at Shannon Semiconductor TechnologyLtd as potential shareholders, the cost of equity is used as the discount rate, rather than the cost of capital (or weighted average cost of capital, WACC) which accounts for debt. In this calculation we've used 8.9%, which is based on a levered beta of 1.069. Beta is a measure of a stock's volatility, compared to the market as a whole. We get our beta from the industry average beta of globally comparable companies, with an imposed limit between 0.8 and 2.0, which is a reasonable range for a stable business.
SWOT Analysis for Shannon Semiconductor TechnologyLtd
Strength
- Debt is well covered by earnings.
- Dividends are covered by earnings and cash flows.
Weakness
- Earnings declined over the past year.
- Dividend is low compared to the top 25% of dividend payers in the Machinery market.
- Expensive based on P/E ratio and estimated fair value.
Opportunity
- Annual revenue is forecast to grow faster than the Chinese market.
Threat
- Debt is not well covered by operating cash flow.
Looking Ahead:
Valuation is only one side of the coin in terms of building your investment thesis, and it is only one of many factors that you need to assess for a company. DCF models are not the be-all and end-all of investment valuation. Rather it should be seen as a guide to "what assumptions need to be true for this stock to be under/overvalued?" If a company grows at a different rate, or if its cost of equity or risk free rate changes sharply, the output can look very different. For Shannon Semiconductor TechnologyLtd, we've put together three pertinent elements you should further research:
- Risks: To that end, you should be aware of the 1 warning sign we've spotted with Shannon Semiconductor TechnologyLtd .
- Future Earnings: How does 300475's growth rate compare to its peers and the wider market? Dig deeper into the analyst consensus number for the upcoming years by interacting with our free analyst growth expectation chart.
- Other Solid Businesses: Low debt, high returns on equity and good past performance are fundamental to a strong business. Why not explore our interactive list of stocks with solid business fundamentals to see if there are other companies you may not have considered!
PS. The Simply Wall St app conducts a discounted cash flow valuation for every stock on the SZSE every day. If you want to find the calculation for other stocks just search here.
New: Manage All Your Stock Portfolios in One Place
We've created the ultimate portfolio companion for stock investors, and it's free.
• Connect an unlimited number of Portfolios and see your total in one currency
• Be alerted to new Warning Signs or Risks via email or mobile
• Track the Fair Value of your stocks
Have feedback on this article? Concerned about the content? Get in touch with us directly. Alternatively, email editorial-team (at) simplywallst.com.
This article by Simply Wall St is general in nature. We provide commentary based on historical data and analyst forecasts only using an unbiased methodology and our articles are not intended to be financial advice. It does not constitute a recommendation to buy or sell any stock, and does not take account of your objectives, or your financial situation. We aim to bring you long-term focused analysis driven by fundamental data. Note that our analysis may not factor in the latest price-sensitive company announcements or qualitative material. Simply Wall St has no position in any stocks mentioned.
Have feedback on this article? Concerned about the content? Get in touch with us directly. Alternatively, email editorial-team@simplywallst.com
About SZSE:300475
Shannon Semiconductor TechnologyLtd
Shannon Semiconductor Technology Co.,Ltd.
Adequate balance sheet with moderate growth potential.
Market Insights

Advertisement
Community Narratives
Scaling up in building materials with smart M&A and growing profitability
Fair Value US$2.77|30.0% undervalued
CM
Community Contributor
Hims: The Platform Powering Personalised Healthcare
Fair Value US$114.01|51.9% undervalued
BL
Community Contributor
Undervalued lottery company with strong fundamentals
Fair Value AU$15.00|34.5% undervalued
RO
Community Contributor
Proximus, transferring money from the impatient to the patient investor
Fair Value €16.62|55.1% undervalued
AX
Community Contributor