Calculating The Intrinsic Value Of Hanyu Group Joint-Stock Co., Ltd. (SZSE:300403)


Key Insights
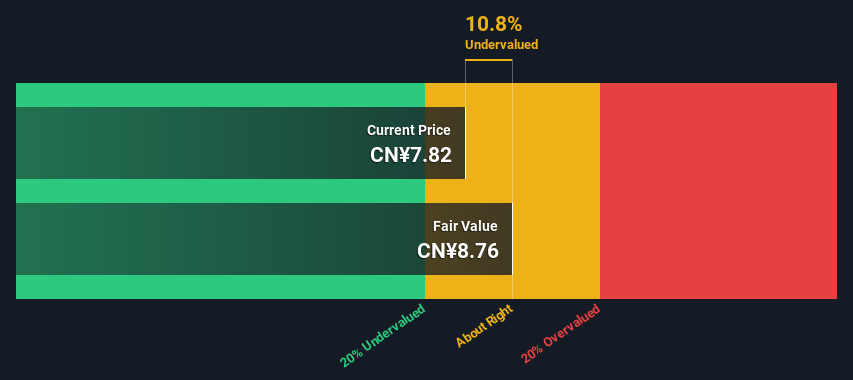
- The projected fair value for Hanyu Group is CN¥8.76 based on 2 Stage Free Cash Flow to Equity
- Current share price of CN¥7.82 suggests Hanyu Group is potentially trading close to its fair value
- Hanyu Group's peers are currently trading at a premium of 656% on average
Does the February share price for Hanyu Group Joint-Stock Co., Ltd. (SZSE:300403) reflect what it's really worth? Today, we will estimate the stock's intrinsic value by projecting its future cash flows and then discounting them to today's value. Our analysis will employ the Discounted Cash Flow (DCF) model. There's really not all that much to it, even though it might appear quite complex.
We would caution that there are many ways of valuing a company and, like the DCF, each technique has advantages and disadvantages in certain scenarios. For those who are keen learners of equity analysis, the Simply Wall St analysis model here may be something of interest to you.
See our latest analysis for Hanyu Group
Crunching The Numbers
We are going to use a two-stage DCF model, which, as the name states, takes into account two stages of growth. The first stage is generally a higher growth period which levels off heading towards the terminal value, captured in the second 'steady growth' period. To start off with, we need to estimate the next ten years of cash flows. Seeing as no analyst estimates of free cash flow are available to us, we have extrapolate the previous free cash flow (FCF) from the company's last reported value. We assume companies with shrinking free cash flow will slow their rate of shrinkage, and that companies with growing free cash flow will see their growth rate slow, over this period. We do this to reflect that growth tends to slow more in the early years than it does in later years.
Generally we assume that a dollar today is more valuable than a dollar in the future, and so the sum of these future cash flows is then discounted to today's value:
10-year free cash flow (FCF) estimate
| 2024 | 2025 | 2026 | 2027 | 2028 | 2029 | 2030 | 2031 | 2032 | 2033 | |
| Levered FCF (CN¥, Millions) | CN¥182.9m | CN¥224.5m | CN¥262.2m | CN¥295.4m | CN¥324.1m | CN¥349.0m | CN¥370.9m | CN¥390.5m | CN¥408.3m | CN¥425.0m |
| Growth Rate Estimate Source | Est @ 31.22% | Est @ 22.74% | Est @ 16.80% | Est @ 12.64% | Est @ 9.73% | Est @ 7.69% | Est @ 6.27% | Est @ 5.27% | Est @ 4.57% | Est @ 4.08% |
| Present Value (CN¥, Millions) Discounted @ 8.7% | CN¥168 | CN¥190 | CN¥204 | CN¥212 | CN¥214 | CN¥212 | CN¥207 | CN¥200 | CN¥193 | CN¥185 |
("Est" = FCF growth rate estimated by Simply Wall St)
Present Value of 10-year Cash Flow (PVCF) = CN¥2.0b
We now need to calculate the Terminal Value, which accounts for all the future cash flows after this ten year period. The Gordon Growth formula is used to calculate Terminal Value at a future annual growth rate equal to the 5-year average of the 10-year government bond yield of 2.9%. We discount the terminal cash flows to today's value at a cost of equity of 8.7%.
Terminal Value (TV)= FCF2033 × (1 + g) ÷ (r – g) = CN¥425m× (1 + 2.9%) ÷ (8.7%– 2.9%) = CN¥7.6b
Present Value of Terminal Value (PVTV)= TV / (1 + r)10= CN¥7.6b÷ ( 1 + 8.7%)10= CN¥3.3b
The total value, or equity value, is then the sum of the present value of the future cash flows, which in this case is CN¥5.3b. To get the intrinsic value per share, we divide this by the total number of shares outstanding. Relative to the current share price of CN¥7.8, the company appears about fair value at a 11% discount to where the stock price trades currently. Valuations are imprecise instruments though, rather like a telescope - move a few degrees and end up in a different galaxy. Do keep this in mind.
Important Assumptions
Now the most important inputs to a discounted cash flow are the discount rate, and of course, the actual cash flows. If you don't agree with these result, have a go at the calculation yourself and play with the assumptions. The DCF also does not consider the possible cyclicality of an industry, or a company's future capital requirements, so it does not give a full picture of a company's potential performance. Given that we are looking at Hanyu Group as potential shareholders, the cost of equity is used as the discount rate, rather than the cost of capital (or weighted average cost of capital, WACC) which accounts for debt. In this calculation we've used 8.7%, which is based on a levered beta of 1.022. Beta is a measure of a stock's volatility, compared to the market as a whole. We get our beta from the industry average beta of globally comparable companies, with an imposed limit between 0.8 and 2.0, which is a reasonable range for a stable business.
SWOT Analysis for Hanyu Group
- Earnings growth over the past year exceeded the industry.
- Debt is not viewed as a risk.
- Dividend is in the top 25% of dividend payers in the market.
- Earnings growth over the past year is below its 5-year average.
- Annual earnings are forecast to grow for the next 3 years.
- Current share price is below our estimate of fair value.
- Dividends are not covered by cash flow.
Next Steps:
Valuation is only one side of the coin in terms of building your investment thesis, and it shouldn't be the only metric you look at when researching a company. It's not possible to obtain a foolproof valuation with a DCF model. Rather it should be seen as a guide to "what assumptions need to be true for this stock to be under/overvalued?" If a company grows at a different rate, or if its cost of equity or risk free rate changes sharply, the output can look very different. For Hanyu Group, there are three important aspects you should explore:
- Risks: Be aware that Hanyu Group is showing 1 warning sign in our investment analysis , you should know about...
- Future Earnings: How does 300403's growth rate compare to its peers and the wider market? Dig deeper into the analyst consensus number for the upcoming years by interacting with our free analyst growth expectation chart.
- Other High Quality Alternatives: Do you like a good all-rounder? Explore our interactive list of high quality stocks to get an idea of what else is out there you may be missing!
PS. The Simply Wall St app conducts a discounted cash flow valuation for every stock on the SZSE every day. If you want to find the calculation for other stocks just search here.
If you're looking to trade Hanyu Group, open an account with the lowest-cost platform trusted by professionals, Interactive Brokers.
With clients in over 200 countries and territories, and access to 160 markets, IBKR lets you trade stocks, options, futures, forex, bonds and funds from a single integrated account.
Enjoy no hidden fees, no account minimums, and FX conversion rates as low as 0.03%, far better than what most brokers offer.
Sponsored ContentValuation is complex, but we're here to simplify it.
Discover if Hanyu Group might be undervalued or overvalued with our detailed analysis, featuring fair value estimates, potential risks, dividends, insider trades, and its financial condition.
Access Free AnalysisHave feedback on this article? Concerned about the content? Get in touch with us directly. Alternatively, email editorial-team (at) simplywallst.com.
This article by Simply Wall St is general in nature. We provide commentary based on historical data and analyst forecasts only using an unbiased methodology and our articles are not intended to be financial advice. It does not constitute a recommendation to buy or sell any stock, and does not take account of your objectives, or your financial situation. We aim to bring you long-term focused analysis driven by fundamental data. Note that our analysis may not factor in the latest price-sensitive company announcements or qualitative material. Simply Wall St has no position in any stocks mentioned.
About SZSE:300403
Hanyu Group
Researches, develops, produces, and sells drainage pumps for household appliances in China.
Flawless balance sheet average dividend payer.
Market Insights

Community Narratives


