SanFeng Intelligent Equipment Group Co., Ltd. (SZSE:300276) Stock Rockets 31% As Investors Are Less Pessimistic Than Expected


Despite an already strong run, SanFeng Intelligent Equipment Group Co., Ltd. (SZSE:300276) shares have been powering on, with a gain of 31% in the last thirty days. The last month tops off a massive increase of 265% in the last year.
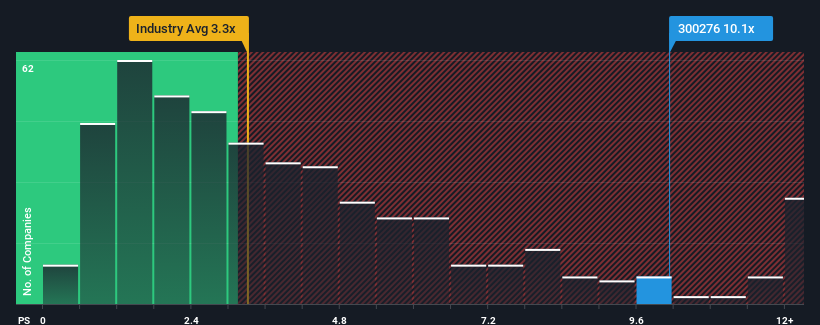
Since its price has surged higher, given around half the companies in China's Machinery industry have price-to-sales ratios (or "P/S") below 3.3x, you may consider SanFeng Intelligent Equipment Group as a stock to avoid entirely with its 10.1x P/S ratio. However, the P/S might be quite high for a reason and it requires further investigation to determine if it's justified.
View our latest analysis for SanFeng Intelligent Equipment Group
What Does SanFeng Intelligent Equipment Group's P/S Mean For Shareholders?
The revenue growth achieved at SanFeng Intelligent Equipment Group over the last year would be more than acceptable for most companies. One possibility is that the P/S ratio is high because investors think this respectable revenue growth will be enough to outperform the broader industry in the near future. You'd really hope so, otherwise you're paying a pretty hefty price for no particular reason.
Want the full picture on earnings, revenue and cash flow for the company? Then our free report on SanFeng Intelligent Equipment Group will help you shine a light on its historical performance.Is There Enough Revenue Growth Forecasted For SanFeng Intelligent Equipment Group?
The only time you'd be truly comfortable seeing a P/S as steep as SanFeng Intelligent Equipment Group's is when the company's growth is on track to outshine the industry decidedly.
Retrospectively, the last year delivered an exceptional 30% gain to the company's top line. Pleasingly, revenue has also lifted 67% in aggregate from three years ago, thanks to the last 12 months of growth. Therefore, it's fair to say the revenue growth recently has been superb for the company.
Comparing the recent medium-term revenue trends against the industry's one-year growth forecast of 22% shows it's noticeably less attractive.
With this information, we find it concerning that SanFeng Intelligent Equipment Group is trading at a P/S higher than the industry. Apparently many investors in the company are way more bullish than recent times would indicate and aren't willing to let go of their stock at any price. Only the boldest would assume these prices are sustainable as a continuation of recent revenue trends is likely to weigh heavily on the share price eventually.
The Final Word
Shares in SanFeng Intelligent Equipment Group have seen a strong upwards swing lately, which has really helped boost its P/S figure. We'd say the price-to-sales ratio's power isn't primarily as a valuation instrument but rather to gauge current investor sentiment and future expectations.
Our examination of SanFeng Intelligent Equipment Group revealed its poor three-year revenue trends aren't detracting from the P/S as much as we though, given they look worse than current industry expectations. When we observe slower-than-industry revenue growth alongside a high P/S ratio, we assume there to be a significant risk of the share price decreasing, which would result in a lower P/S ratio. Unless the recent medium-term conditions improve markedly, it's very challenging to accept these the share price as being reasonable.
You need to take note of risks, for example - SanFeng Intelligent Equipment Group has 2 warning signs (and 1 which shouldn't be ignored) we think you should know about.
If strong companies turning a profit tickle your fancy, then you'll want to check out this free list of interesting companies that trade on a low P/E (but have proven they can grow earnings).
If you're looking to trade SanFeng Intelligent Equipment Group, open an account with the lowest-cost platform trusted by professionals, Interactive Brokers.
With clients in over 200 countries and territories, and access to 160 markets, IBKR lets you trade stocks, options, futures, forex, bonds and funds from a single integrated account.
Enjoy no hidden fees, no account minimums, and FX conversion rates as low as 0.03%, far better than what most brokers offer.
Sponsored ContentNew: Manage All Your Stock Portfolios in One Place
We've created the ultimate portfolio companion for stock investors, and it's free.
• Connect an unlimited number of Portfolios and see your total in one currency
• Be alerted to new Warning Signs or Risks via email or mobile
• Track the Fair Value of your stocks
Have feedback on this article? Concerned about the content? Get in touch with us directly. Alternatively, email editorial-team (at) simplywallst.com.
This article by Simply Wall St is general in nature. We provide commentary based on historical data and analyst forecasts only using an unbiased methodology and our articles are not intended to be financial advice. It does not constitute a recommendation to buy or sell any stock, and does not take account of your objectives, or your financial situation. We aim to bring you long-term focused analysis driven by fundamental data. Note that our analysis may not factor in the latest price-sensitive company announcements or qualitative material. Simply Wall St has no position in any stocks mentioned.
About SZSE:300276
SanFeng Intelligent Equipment Group
SanFeng Intelligent Equipment Group Co., Ltd.
Adequate balance sheet with acceptable track record.
Market Insights

Community Narratives


