What Ken Holding Co., Ltd.'s (SZSE:300126) 29% Share Price Gain Is Not Telling You


Those holding Ken Holding Co., Ltd. (SZSE:300126) shares would be relieved that the share price has rebounded 29% in the last thirty days, but it needs to keep going to repair the recent damage it has caused to investor portfolios. Not all shareholders will be feeling jubilant, since the share price is still down a very disappointing 18% in the last twelve months.
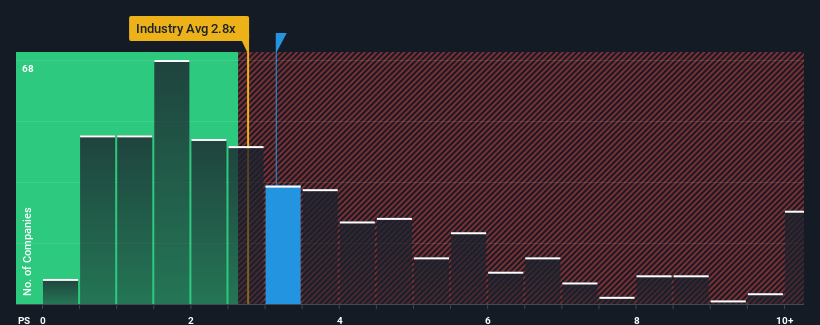
Even after such a large jump in price, it's still not a stretch to say that Ken Holding's price-to-sales (or "P/S") ratio of 3.1x right now seems quite "middle-of-the-road" compared to the Machinery industry in China, where the median P/S ratio is around 2.8x. However, investors might be overlooking a clear opportunity or potential setback if there is no rational basis for the P/S.
See our latest analysis for Ken Holding
How Ken Holding Has Been Performing
The revenue growth achieved at Ken Holding over the last year would be more than acceptable for most companies. One possibility is that the P/S is moderate because investors think this respectable revenue growth might not be enough to outperform the broader industry in the near future. If that doesn't eventuate, then existing shareholders probably aren't too pessimistic about the future direction of the share price.
We don't have analyst forecasts, but you can see how recent trends are setting up the company for the future by checking out our free report on Ken Holding's earnings, revenue and cash flow.Do Revenue Forecasts Match The P/S Ratio?
In order to justify its P/S ratio, Ken Holding would need to produce growth that's similar to the industry.
If we review the last year of revenue growth, the company posted a worthy increase of 9.2%. Revenue has also lifted 22% in aggregate from three years ago, partly thanks to the last 12 months of growth. Therefore, it's fair to say the revenue growth recently has been respectable for the company.
This is in contrast to the rest of the industry, which is expected to grow by 27% over the next year, materially higher than the company's recent medium-term annualised growth rates.
With this in mind, we find it intriguing that Ken Holding's P/S is comparable to that of its industry peers. Apparently many investors in the company are less bearish than recent times would indicate and aren't willing to let go of their stock right now. They may be setting themselves up for future disappointment if the P/S falls to levels more in line with recent growth rates.
What Does Ken Holding's P/S Mean For Investors?
Ken Holding appears to be back in favour with a solid price jump bringing its P/S back in line with other companies in the industry It's argued the price-to-sales ratio is an inferior measure of value within certain industries, but it can be a powerful business sentiment indicator.
Our examination of Ken Holding revealed its poor three-year revenue trends aren't resulting in a lower P/S as per our expectations, given they look worse than current industry outlook. When we see weak revenue with slower than industry growth, we suspect the share price is at risk of declining, bringing the P/S back in line with expectations. Unless the recent medium-term conditions improve, it's hard to accept the current share price as fair value.
It's always necessary to consider the ever-present spectre of investment risk. We've identified 1 warning sign with Ken Holding, and understanding should be part of your investment process.
Of course, profitable companies with a history of great earnings growth are generally safer bets. So you may wish to see this free collection of other companies that have reasonable P/E ratios and have grown earnings strongly.
Valuation is complex, but we're here to simplify it.
Discover if Ken Holding might be undervalued or overvalued with our detailed analysis, featuring fair value estimates, potential risks, dividends, insider trades, and its financial condition.
Access Free AnalysisHave feedback on this article? Concerned about the content? Get in touch with us directly. Alternatively, email editorial-team (at) simplywallst.com.
This article by Simply Wall St is general in nature. We provide commentary based on historical data and analyst forecasts only using an unbiased methodology and our articles are not intended to be financial advice. It does not constitute a recommendation to buy or sell any stock, and does not take account of your objectives, or your financial situation. We aim to bring you long-term focused analysis driven by fundamental data. Note that our analysis may not factor in the latest price-sensitive company announcements or qualitative material. Simply Wall St has no position in any stocks mentioned.
About SZSE:300126
Ken Holding
Engages in the research, development, manufacture, and sale of professional power tools.
Flawless balance sheet very low.
Market Insights

Community Narratives


