Shenzhen Inovance Technology Co.,Ltd (SZSE:300124) Shares Could Be 29% Below Their Intrinsic Value Estimate


Key Insights
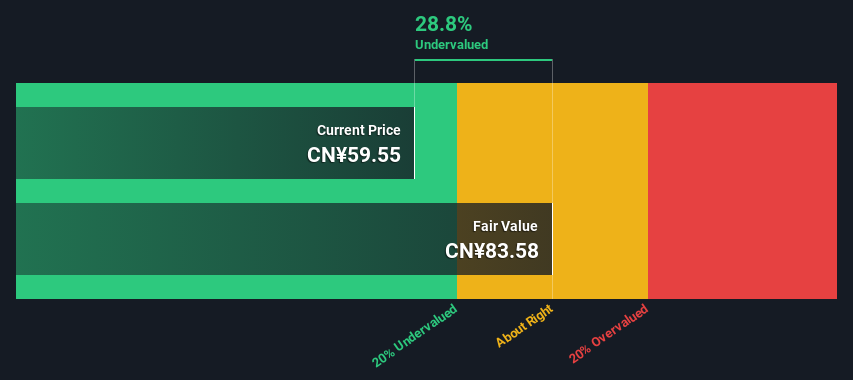
- Shenzhen Inovance TechnologyLtd's estimated fair value is CN¥83.58 based on 2 Stage Free Cash Flow to Equity
- Current share price of CN¥59.55 suggests Shenzhen Inovance TechnologyLtd is potentially 29% undervalued
- Analyst price target for 300124 is CN¥76.25 which is 8.8% below our fair value estimate
Today we will run through one way of estimating the intrinsic value of Shenzhen Inovance Technology Co.,Ltd (SZSE:300124) by taking the expected future cash flows and discounting them to today's value. We will take advantage of the Discounted Cash Flow (DCF) model for this purpose. There's really not all that much to it, even though it might appear quite complex.
Companies can be valued in a lot of ways, so we would point out that a DCF is not perfect for every situation. If you want to learn more about discounted cash flow, the rationale behind this calculation can be read in detail in the Simply Wall St analysis model.
See our latest analysis for Shenzhen Inovance TechnologyLtd
Step By Step Through The Calculation
We are going to use a two-stage DCF model, which, as the name states, takes into account two stages of growth. The first stage is generally a higher growth period which levels off heading towards the terminal value, captured in the second 'steady growth' period. To start off with, we need to estimate the next ten years of cash flows. Where possible we use analyst estimates, but when these aren't available we extrapolate the previous free cash flow (FCF) from the last estimate or reported value. We assume companies with shrinking free cash flow will slow their rate of shrinkage, and that companies with growing free cash flow will see their growth rate slow, over this period. We do this to reflect that growth tends to slow more in the early years than it does in later years.
A DCF is all about the idea that a dollar in the future is less valuable than a dollar today, and so the sum of these future cash flows is then discounted to today's value:
10-year free cash flow (FCF) forecast
| 2024 | 2025 | 2026 | 2027 | 2028 | 2029 | 2030 | 2031 | 2032 | 2033 | |
| Levered FCF (CN¥, Millions) | CN¥3.23b | CN¥4.62b | CN¥5.87b | CN¥8.80b | CN¥11.7b | CN¥13.9b | CN¥15.9b | CN¥17.6b | CN¥19.1b | CN¥20.4b |
| Growth Rate Estimate Source | Analyst x6 | Analyst x6 | Analyst x1 | Analyst x1 | Analyst x1 | Est @ 18.98% | Est @ 14.17% | Est @ 10.80% | Est @ 8.44% | Est @ 6.79% |
| Present Value (CN¥, Millions) Discounted @ 8.8% | CN¥3.0k | CN¥3.9k | CN¥4.6k | CN¥6.3k | CN¥7.7k | CN¥8.4k | CN¥8.8k | CN¥9.0k | CN¥8.9k | CN¥8.8k |
("Est" = FCF growth rate estimated by Simply Wall St)
Present Value of 10-year Cash Flow (PVCF) = CN¥69b
The second stage is also known as Terminal Value, this is the business's cash flow after the first stage. The Gordon Growth formula is used to calculate Terminal Value at a future annual growth rate equal to the 5-year average of the 10-year government bond yield of 2.9%. We discount the terminal cash flows to today's value at a cost of equity of 8.8%.
Terminal Value (TV)= FCF2033 × (1 + g) ÷ (r – g) = CN¥20b× (1 + 2.9%) ÷ (8.8%– 2.9%) = CN¥358b
Present Value of Terminal Value (PVTV)= TV / (1 + r)10= CN¥358b÷ ( 1 + 8.8%)10= CN¥154b
The total value is the sum of cash flows for the next ten years plus the discounted terminal value, which results in the Total Equity Value, which in this case is CN¥224b. In the final step we divide the equity value by the number of shares outstanding. Relative to the current share price of CN¥59.6, the company appears a touch undervalued at a 29% discount to where the stock price trades currently. Valuations are imprecise instruments though, rather like a telescope - move a few degrees and end up in a different galaxy. Do keep this in mind.
The Assumptions
Now the most important inputs to a discounted cash flow are the discount rate, and of course, the actual cash flows. Part of investing is coming up with your own evaluation of a company's future performance, so try the calculation yourself and check your own assumptions. The DCF also does not consider the possible cyclicality of an industry, or a company's future capital requirements, so it does not give a full picture of a company's potential performance. Given that we are looking at Shenzhen Inovance TechnologyLtd as potential shareholders, the cost of equity is used as the discount rate, rather than the cost of capital (or weighted average cost of capital, WACC) which accounts for debt. In this calculation we've used 8.8%, which is based on a levered beta of 1.039. Beta is a measure of a stock's volatility, compared to the market as a whole. We get our beta from the industry average beta of globally comparable companies, with an imposed limit between 0.8 and 2.0, which is a reasonable range for a stable business.
SWOT Analysis for Shenzhen Inovance TechnologyLtd
- Earnings growth over the past year exceeded the industry.
- Debt is not viewed as a risk.
- Dividends are covered by earnings and cash flows.
- Earnings growth over the past year is below its 5-year average.
- Dividend is low compared to the top 25% of dividend payers in the Machinery market.
- Annual revenue is forecast to grow faster than the Chinese market.
- Trading below our estimate of fair value by more than 20%.
- Annual earnings are forecast to grow slower than the Chinese market.
Moving On:
Valuation is only one side of the coin in terms of building your investment thesis, and it shouldn't be the only metric you look at when researching a company. DCF models are not the be-all and end-all of investment valuation. Instead the best use for a DCF model is to test certain assumptions and theories to see if they would lead to the company being undervalued or overvalued. If a company grows at a different rate, or if its cost of equity or risk free rate changes sharply, the output can look very different. Why is the intrinsic value higher than the current share price? For Shenzhen Inovance TechnologyLtd, we've compiled three additional elements you should further research:
- Financial Health: Does 300124 have a healthy balance sheet? Take a look at our free balance sheet analysis with six simple checks on key factors like leverage and risk.
- Future Earnings: How does 300124's growth rate compare to its peers and the wider market? Dig deeper into the analyst consensus number for the upcoming years by interacting with our free analyst growth expectation chart.
- Other Solid Businesses: Low debt, high returns on equity and good past performance are fundamental to a strong business. Why not explore our interactive list of stocks with solid business fundamentals to see if there are other companies you may not have considered!
PS. The Simply Wall St app conducts a discounted cash flow valuation for every stock on the SZSE every day. If you want to find the calculation for other stocks just search here.
New: Manage All Your Stock Portfolios in One Place
We've created the ultimate portfolio companion for stock investors, and it's free.
• Connect an unlimited number of Portfolios and see your total in one currency
• Be alerted to new Warning Signs or Risks via email or mobile
• Track the Fair Value of your stocks
Have feedback on this article? Concerned about the content? Get in touch with us directly. Alternatively, email editorial-team (at) simplywallst.com.
This article by Simply Wall St is general in nature. We provide commentary based on historical data and analyst forecasts only using an unbiased methodology and our articles are not intended to be financial advice. It does not constitute a recommendation to buy or sell any stock, and does not take account of your objectives, or your financial situation. We aim to bring you long-term focused analysis driven by fundamental data. Note that our analysis may not factor in the latest price-sensitive company announcements or qualitative material. Simply Wall St has no position in any stocks mentioned.
About SZSE:300124
Shenzhen Inovance TechnologyLtd
Manufactures and sells industrial automation control solutions in China and internationally.
Flawless balance sheet average dividend payer.

