- China
- /
- Aerospace & Defense
- /
- SZSE:300123
YaGuang Technology Group Company Limited (SZSE:300123) Shares Fly 40% But Investors Aren't Buying For Growth


Those holding YaGuang Technology Group Company Limited (SZSE:300123) shares would be relieved that the share price has rebounded 40% in the last thirty days, but it needs to keep going to repair the recent damage it has caused to investor portfolios. Unfortunately, the gains of the last month did little to right the losses of the last year with the stock still down 26% over that time.
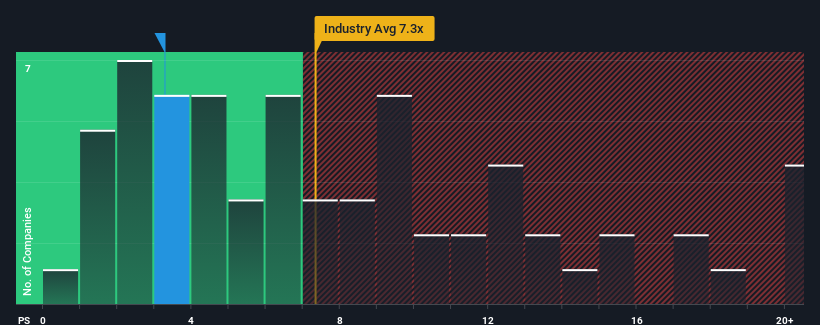
Even after such a large jump in price, YaGuang Technology Group may still look like a strong buying opportunity at present with its price-to-sales (or "P/S") ratio of 3.3x, considering almost half of all companies in the Aerospace & Defense industry in China have P/S ratios greater than 7.3x and even P/S higher than 12x aren't out of the ordinary. Although, it's not wise to just take the P/S at face value as there may be an explanation why it's so limited.
View our latest analysis for YaGuang Technology Group
What Does YaGuang Technology Group's Recent Performance Look Like?
Revenue has risen firmly for YaGuang Technology Group recently, which is pleasing to see. It might be that many expect the respectable revenue performance to degrade substantially, which has repressed the P/S. If you like the company, you'd be hoping this isn't the case so that you could potentially pick up some stock while it's out of favour.
Although there are no analyst estimates available for YaGuang Technology Group, take a look at this free data-rich visualisation to see how the company stacks up on earnings, revenue and cash flow.Is There Any Revenue Growth Forecasted For YaGuang Technology Group?
In order to justify its P/S ratio, YaGuang Technology Group would need to produce anemic growth that's substantially trailing the industry.
Retrospectively, the last year delivered an exceptional 27% gain to the company's top line. However, this wasn't enough as the latest three year period has seen the company endure a nasty 22% drop in revenue in aggregate. Therefore, it's fair to say the revenue growth recently has been undesirable for the company.
Weighing that medium-term revenue trajectory against the broader industry's one-year forecast for expansion of 48% shows it's an unpleasant look.
With this information, we are not surprised that YaGuang Technology Group is trading at a P/S lower than the industry. Nonetheless, there's no guarantee the P/S has reached a floor yet with revenue going in reverse. Even just maintaining these prices could be difficult to achieve as recent revenue trends are already weighing down the shares.
The Key Takeaway
YaGuang Technology Group's recent share price jump still sees fails to bring its P/S alongside the industry median. Using the price-to-sales ratio alone to determine if you should sell your stock isn't sensible, however it can be a practical guide to the company's future prospects.
Our examination of YaGuang Technology Group confirms that the company's shrinking revenue over the past medium-term is a key factor in its low price-to-sales ratio, given the industry is projected to grow. Right now shareholders are accepting the low P/S as they concede future revenue probably won't provide any pleasant surprises either. If recent medium-term revenue trends continue, it's hard to see the share price moving strongly in either direction in the near future under these circumstances.
Don't forget that there may be other risks. For instance, we've identified 2 warning signs for YaGuang Technology Group that you should be aware of.
Of course, profitable companies with a history of great earnings growth are generally safer bets. So you may wish to see this free collection of other companies that have reasonable P/E ratios and have grown earnings strongly.
If you're looking to trade YaGuang Technology Group, open an account with the lowest-cost platform trusted by professionals, Interactive Brokers.
With clients in over 200 countries and territories, and access to 160 markets, IBKR lets you trade stocks, options, futures, forex, bonds and funds from a single integrated account.
Enjoy no hidden fees, no account minimums, and FX conversion rates as low as 0.03%, far better than what most brokers offer.
Sponsored ContentNew: Manage All Your Stock Portfolios in One Place
We've created the ultimate portfolio companion for stock investors, and it's free.
• Connect an unlimited number of Portfolios and see your total in one currency
• Be alerted to new Warning Signs or Risks via email or mobile
• Track the Fair Value of your stocks
Have feedback on this article? Concerned about the content? Get in touch with us directly. Alternatively, email editorial-team (at) simplywallst.com.
This article by Simply Wall St is general in nature. We provide commentary based on historical data and analyst forecasts only using an unbiased methodology and our articles are not intended to be financial advice. It does not constitute a recommendation to buy or sell any stock, and does not take account of your objectives, or your financial situation. We aim to bring you long-term focused analysis driven by fundamental data. Note that our analysis may not factor in the latest price-sensitive company announcements or qualitative material. Simply Wall St has no position in any stocks mentioned.
About SZSE:300123
YaGuang Technology Group
Researches, develops, manufactures, and sells military microwave electronics and intelligent ships in China.
Mediocre balance sheet and slightly overvalued.
Market Insights

Community Narratives


