
Advertisement
Some Confidence Is Lacking In Zhejiang Fenglong Electric Co., Ltd. (SZSE:002931) As Shares Slide 27%

Zhejiang Fenglong Electric Co., Ltd. (SZSE:002931) shareholders won't be pleased to see that the share price has had a very rough month, dropping 27% and undoing the prior period's positive performance. Indeed, the recent drop has reduced its annual gain to a relatively sedate 6.7% over the last twelve months.
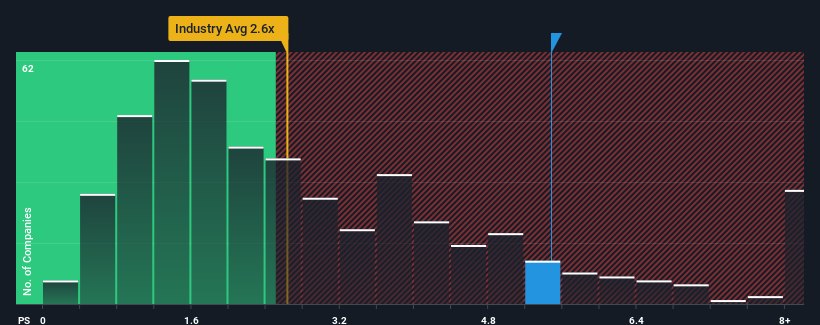
Even after such a large drop in price, you could still be forgiven for thinking Zhejiang Fenglong Electric is a stock to steer clear of with a price-to-sales ratios (or "P/S") of 5.5x, considering almost half the companies in China's Machinery industry have P/S ratios below 2.6x. Nonetheless, we'd need to dig a little deeper to determine if there is a rational basis for the highly elevated P/S.
Check out our latest analysis for Zhejiang Fenglong Electric
What Does Zhejiang Fenglong Electric's P/S Mean For Shareholders?
For instance, Zhejiang Fenglong Electric's receding revenue in recent times would have to be some food for thought. Perhaps the market believes the company can do enough to outperform the rest of the industry in the near future, which is keeping the P/S ratio high. However, if this isn't the case, investors might get caught out paying too much for the stock.
Although there are no analyst estimates available for Zhejiang Fenglong Electric, take a look at this free data-rich visualisation to see how the company stacks up on earnings, revenue and cash flow.Is There Enough Revenue Growth Forecasted For Zhejiang Fenglong Electric?
There's an inherent assumption that a company should far outperform the industry for P/S ratios like Zhejiang Fenglong Electric's to be considered reasonable.
Retrospectively, the last year delivered a frustrating 26% decrease to the company's top line. The last three years don't look nice either as the company has shrunk revenue by 21% in aggregate. Accordingly, shareholders would have felt downbeat about the medium-term rates of revenue growth.
In contrast to the company, the rest of the industry is expected to grow by 24% over the next year, which really puts the company's recent medium-term revenue decline into perspective.
In light of this, it's alarming that Zhejiang Fenglong Electric's P/S sits above the majority of other companies. It seems most investors are ignoring the recent poor growth rate and are hoping for a turnaround in the company's business prospects. There's a very good chance existing shareholders are setting themselves up for future disappointment if the P/S falls to levels more in line with the recent negative growth rates.
What We Can Learn From Zhejiang Fenglong Electric's P/S?
Zhejiang Fenglong Electric's shares may have suffered, but its P/S remains high. We'd say the price-to-sales ratio's power isn't primarily as a valuation instrument but rather to gauge current investor sentiment and future expectations.
Our examination of Zhejiang Fenglong Electric revealed its shrinking revenue over the medium-term isn't resulting in a P/S as low as we expected, given the industry is set to grow. When we see revenue heading backwards and underperforming the industry forecasts, we feel the possibility of the share price declining is very real, bringing the P/S back into the realm of reasonability. Unless the recent medium-term conditions improve markedly, investors will have a hard time accepting the share price as fair value.
You should always think about risks. Case in point, we've spotted 2 warning signs for Zhejiang Fenglong Electric you should be aware of, and 1 of them shouldn't be ignored.
If you're unsure about the strength of Zhejiang Fenglong Electric's business, why not explore our interactive list of stocks with solid business fundamentals for some other companies you may have missed.
Valuation is complex, but we're here to simplify it.
Discover if Zhejiang Fenglong Electric might be undervalued or overvalued with our detailed analysis, featuring fair value estimates, potential risks, dividends, insider trades, and its financial condition.
Access Free AnalysisHave feedback on this article? Concerned about the content? Get in touch with us directly. Alternatively, email editorial-team (at) simplywallst.com.
This article by Simply Wall St is general in nature. We provide commentary based on historical data and analyst forecasts only using an unbiased methodology and our articles are not intended to be financial advice. It does not constitute a recommendation to buy or sell any stock, and does not take account of your objectives, or your financial situation. We aim to bring you long-term focused analysis driven by fundamental data. Note that our analysis may not factor in the latest price-sensitive company announcements or qualitative material. Simply Wall St has no position in any stocks mentioned.
About SZSE:002931
Zhejiang Fenglong Electric
Engages in the research and development, production, and sale of garden machinery parts in China.
Adequate balance sheet slight.
Market Insights

Advertisement
Community Narratives
Scaling up in building materials with smart M&A and growing profitability
Fair Value US$2.77|28.9% undervalued
CM
Community Contributor
Hims: The Platform Powering Personalised Healthcare
Fair Value US$114.01|46.3% undervalued
BL
Community Contributor
Undervalued lottery company with strong fundamentals
Fair Value AU$15.00|35.8% undervalued
RO
Community Contributor
Proximus, transferring money from the impatient to the patient investor
Fair Value €16.62|55.2% undervalued
AX
Community Contributor