- China
- /
- Electrical
- /
- SZSE:002580
Shandong Sacred Sun Power Sources Co.,Ltd (SZSE:002580) Stock Rockets 26% But Many Are Still Ignoring The Company


Those holding Shandong Sacred Sun Power Sources Co.,Ltd (SZSE:002580) shares would be relieved that the share price has rebounded 26% in the last thirty days, but it needs to keep going to repair the recent damage it has caused to investor portfolios. Unfortunately, the gains of the last month did little to right the losses of the last year with the stock still down 31% over that time.
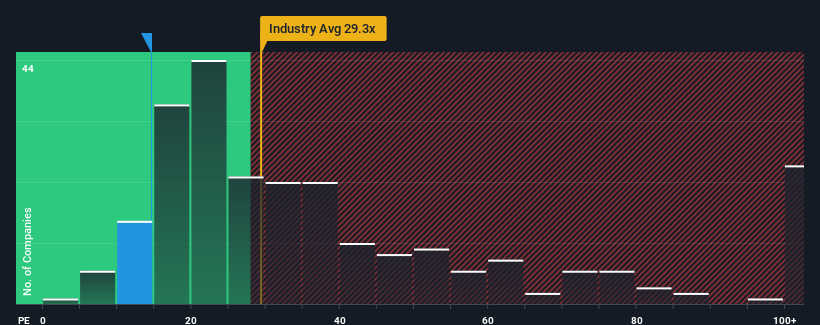
Although its price has surged higher, given about half the companies in China have price-to-earnings ratios (or "P/E's") above 30x, you may still consider Shandong Sacred Sun Power SourcesLtd as a highly attractive investment with its 14.6x P/E ratio. However, the P/E might be quite low for a reason and it requires further investigation to determine if it's justified.
Recent times have been quite advantageous for Shandong Sacred Sun Power SourcesLtd as its earnings have been rising very briskly. It might be that many expect the strong earnings performance to degrade substantially, which has repressed the P/E. If you like the company, you'd be hoping this isn't the case so that you could potentially pick up some stock while it's out of favour.
Check out our latest analysis for Shandong Sacred Sun Power SourcesLtd
Does Growth Match The Low P/E?
There's an inherent assumption that a company should far underperform the market for P/E ratios like Shandong Sacred Sun Power SourcesLtd's to be considered reasonable.
Taking a look back first, we see that the company grew earnings per share by an impressive 130% last year. The latest three year period has also seen an excellent 479% overall rise in EPS, aided by its short-term performance. Accordingly, shareholders would have probably welcomed those medium-term rates of earnings growth.
Comparing that to the market, which is only predicted to deliver 41% growth in the next 12 months, the company's momentum is stronger based on recent medium-term annualised earnings results.
With this information, we find it odd that Shandong Sacred Sun Power SourcesLtd is trading at a P/E lower than the market. Apparently some shareholders believe the recent performance has exceeded its limits and have been accepting significantly lower selling prices.
What We Can Learn From Shandong Sacred Sun Power SourcesLtd's P/E?
Shandong Sacred Sun Power SourcesLtd's recent share price jump still sees its P/E sitting firmly flat on the ground. Using the price-to-earnings ratio alone to determine if you should sell your stock isn't sensible, however it can be a practical guide to the company's future prospects.
Our examination of Shandong Sacred Sun Power SourcesLtd revealed its three-year earnings trends aren't contributing to its P/E anywhere near as much as we would have predicted, given they look better than current market expectations. There could be some major unobserved threats to earnings preventing the P/E ratio from matching this positive performance. It appears many are indeed anticipating earnings instability, because the persistence of these recent medium-term conditions would normally provide a boost to the share price.
Having said that, be aware Shandong Sacred Sun Power SourcesLtd is showing 1 warning sign in our investment analysis, you should know about.
Of course, you might also be able to find a better stock than Shandong Sacred Sun Power SourcesLtd. So you may wish to see this free collection of other companies that have reasonable P/E ratios and have grown earnings strongly.
If you're looking to trade Shandong Sacred Sun Power SourcesLtd, open an account with the lowest-cost platform trusted by professionals, Interactive Brokers.
With clients in over 200 countries and territories, and access to 160 markets, IBKR lets you trade stocks, options, futures, forex, bonds and funds from a single integrated account.
Enjoy no hidden fees, no account minimums, and FX conversion rates as low as 0.03%, far better than what most brokers offer.
Sponsored ContentNew: Manage All Your Stock Portfolios in One Place
We've created the ultimate portfolio companion for stock investors, and it's free.
• Connect an unlimited number of Portfolios and see your total in one currency
• Be alerted to new Warning Signs or Risks via email or mobile
• Track the Fair Value of your stocks
Have feedback on this article? Concerned about the content? Get in touch with us directly. Alternatively, email editorial-team (at) simplywallst.com.
This article by Simply Wall St is general in nature. We provide commentary based on historical data and analyst forecasts only using an unbiased methodology and our articles are not intended to be financial advice. It does not constitute a recommendation to buy or sell any stock, and does not take account of your objectives, or your financial situation. We aim to bring you long-term focused analysis driven by fundamental data. Note that our analysis may not factor in the latest price-sensitive company announcements or qualitative material. Simply Wall St has no position in any stocks mentioned.
About SZSE:002580
Shandong Sacred Sun Power SourcesLtd
Provides green energy solutions worldwide.
Flawless balance sheet with proven track record.
Market Insights

Community Narratives


