Revenues Not Telling The Story For Anhui Ankai Automobile Co., Ltd (SZSE:000868) After Shares Rise 33%


Those holding Anhui Ankai Automobile Co., Ltd (SZSE:000868) shares would be relieved that the share price has rebounded 33% in the last thirty days, but it needs to keep going to repair the recent damage it has caused to investor portfolios. Unfortunately, the gains of the last month did little to right the losses of the last year with the stock still down 28% over that time.
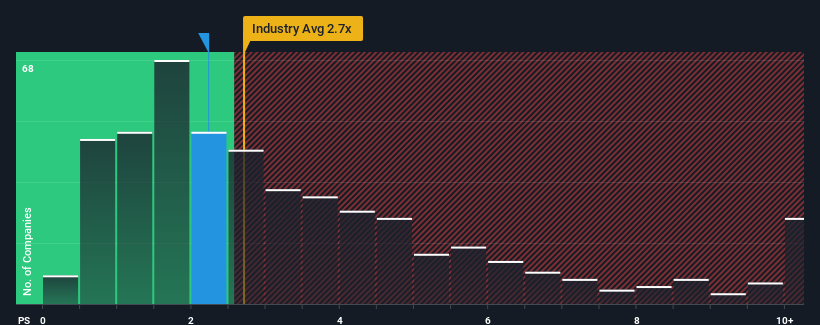
In spite of the firm bounce in price, it's still not a stretch to say that Anhui Ankai Automobile's price-to-sales (or "P/S") ratio of 2.2x right now seems quite "middle-of-the-road" compared to the Machinery industry in China, where the median P/S ratio is around 2.7x. Although, it's not wise to simply ignore the P/S without explanation as investors may be disregarding a distinct opportunity or a costly mistake.
Check out our latest analysis for Anhui Ankai Automobile
What Does Anhui Ankai Automobile's P/S Mean For Shareholders?
The revenue growth achieved at Anhui Ankai Automobile over the last year would be more than acceptable for most companies. It might be that many expect the respectable revenue performance to wane, which has kept the P/S from rising. Those who are bullish on Anhui Ankai Automobile will be hoping that this isn't the case, so that they can pick up the stock at a lower valuation.
Want the full picture on earnings, revenue and cash flow for the company? Then our free report on Anhui Ankai Automobile will help you shine a light on its historical performance.How Is Anhui Ankai Automobile's Revenue Growth Trending?
The only time you'd be comfortable seeing a P/S like Anhui Ankai Automobile's is when the company's growth is tracking the industry closely.
If we review the last year of revenue growth, the company posted a worthy increase of 8.7%. However, this wasn't enough as the latest three year period has seen an unpleasant 13% overall drop in revenue. So unfortunately, we have to acknowledge that the company has not done a great job of growing revenue over that time.
In contrast to the company, the rest of the industry is expected to grow by 27% over the next year, which really puts the company's recent medium-term revenue decline into perspective.
With this information, we find it concerning that Anhui Ankai Automobile is trading at a fairly similar P/S compared to the industry. Apparently many investors in the company are way less bearish than recent times would indicate and aren't willing to let go of their stock right now. Only the boldest would assume these prices are sustainable as a continuation of recent revenue trends is likely to weigh on the share price eventually.
The Bottom Line On Anhui Ankai Automobile's P/S
Its shares have lifted substantially and now Anhui Ankai Automobile's P/S is back within range of the industry median. We'd say the price-to-sales ratio's power isn't primarily as a valuation instrument but rather to gauge current investor sentiment and future expectations.
Our look at Anhui Ankai Automobile revealed its shrinking revenues over the medium-term haven't impacted the P/S as much as we anticipated, given the industry is set to grow. Even though it matches the industry, we're uncomfortable with the current P/S ratio, as this dismal revenue performance is unlikely to support a more positive sentiment for long. If recent medium-term revenue trends continue, it will place shareholders' investments at risk and potential investors in danger of paying an unnecessary premium.
We don't want to rain on the parade too much, but we did also find 1 warning sign for Anhui Ankai Automobile that you need to be mindful of.
If these risks are making you reconsider your opinion on Anhui Ankai Automobile, explore our interactive list of high quality stocks to get an idea of what else is out there.
New: Manage All Your Stock Portfolios in One Place
We've created the ultimate portfolio companion for stock investors, and it's free.
• Connect an unlimited number of Portfolios and see your total in one currency
• Be alerted to new Warning Signs or Risks via email or mobile
• Track the Fair Value of your stocks
Have feedback on this article? Concerned about the content? Get in touch with us directly. Alternatively, email editorial-team (at) simplywallst.com.
This article by Simply Wall St is general in nature. We provide commentary based on historical data and analyst forecasts only using an unbiased methodology and our articles are not intended to be financial advice. It does not constitute a recommendation to buy or sell any stock, and does not take account of your objectives, or your financial situation. We aim to bring you long-term focused analysis driven by fundamental data. Note that our analysis may not factor in the latest price-sensitive company announcements or qualitative material. Simply Wall St has no position in any stocks mentioned.
About SZSE:000868
Anhui Ankai Automobile
Manufactures and sells large, medium, and light buses and automotive parts in China.
Adequate balance sheet and slightly overvalued.
Similar Companies
Market Insights

Community Narratives


