Pci Technology GroupLtd And 2 Other Global Penny Stocks To Watch Closely

Reviewed by Simply Wall St

Global markets have experienced mixed performance in recent weeks, with smaller-cap indexes outperforming their larger counterparts amid ongoing trade uncertainties and shifting economic policies. Amid these broader market dynamics, the concept of penny stocks—though somewhat outdated—remains relevant as an investment area for those seeking affordability and growth potential. Typically representing smaller or newer companies, penny stocks can offer intriguing opportunities when they are backed by strong financials, making them worth a closer look in today's complex economic landscape.
Top 10 Penny Stocks Globally
| Name | Share Price | Market Cap | Rewards & Risks |
| CNMC Goldmine Holdings (Catalist:5TP) | SGD0.43 | SGD174.27M | ✅ 3 ⚠️ 3 View Analysis > |
| Yangzijiang Shipbuilding (Holdings) (SGX:BS6) | SGD2.18 | SGD8.58B | ✅ 5 ⚠️ 0 View Analysis > |
| Angler Gaming (NGM:ANGL) | SEK3.63 | SEK272.2M | ✅ 4 ⚠️ 3 View Analysis > |
| SKP Resources Bhd (KLSE:SKPRES) | MYR0.85 | MYR1.33B | ✅ 5 ⚠️ 2 View Analysis > |
| NEXG Berhad (KLSE:NEXG) | MYR0.36 | MYR1B | ✅ 4 ⚠️ 3 View Analysis > |
| DXN Holdings Bhd (KLSE:DXN) | MYR0.51 | MYR2.54B | ✅ 5 ⚠️ 0 View Analysis > |
| Lever Style (SEHK:1346) | HK$1.10 | HK$675.12M | ✅ 4 ⚠️ 2 View Analysis > |
| Warpaint London (AIM:W7L) | £3.80 | £290.83M | ✅ 5 ⚠️ 3 View Analysis > |
| Foresight Group Holdings (LSE:FSG) | £3.695 | £417.56M | ✅ 4 ⚠️ 1 View Analysis > |
| QinetiQ Group (LSE:QQ.) | £3.838 | £2.11B | ✅ 5 ⚠️ 1 View Analysis > |
Click here to see the full list of 5,607 stocks from our Global Penny Stocks screener.
We'll examine a selection from our screener results.
Pci Technology GroupLtd (SHSE:600728)
Simply Wall St Financial Health Rating: ★★★★★★
Overview: Pci Technology Group Co., Ltd. offers artificial intelligence technology and products in China, with a market capitalization of approximately CN¥9.89 billion.
Operations: Pci Technology Group Co., Ltd. has not reported any specific revenue segments.
Market Cap: CN¥9.89B
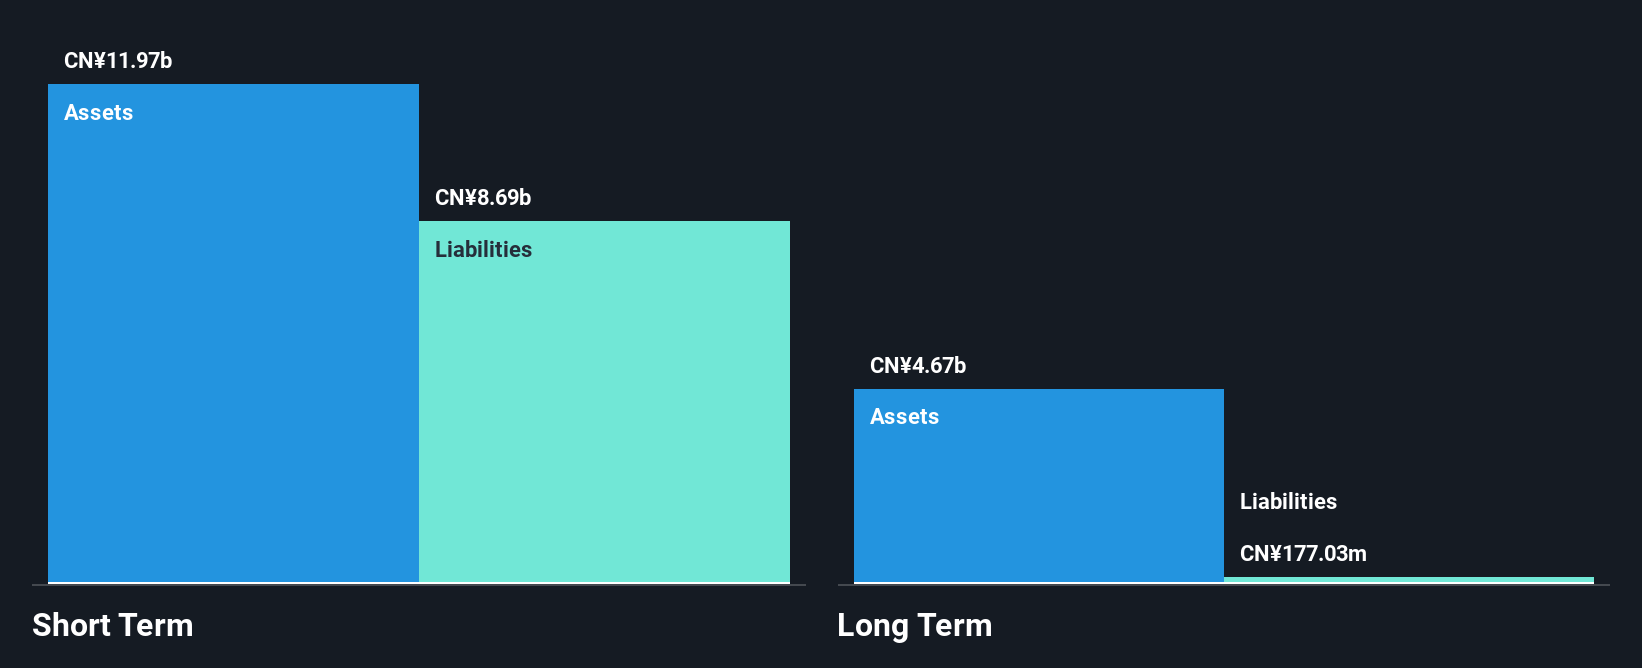
Pci Technology Group Co., Ltd. has shown significant growth, with first-quarter sales for 2025 reaching CN¥2.25 billion, a notable increase from CN¥1.09 billion the previous year. The company turned around its financial performance by reporting a net income of CN¥120.4 million compared to a net loss of CN¥182.8 million last year, marking its recent profitability milestone despite past earnings declines averaging 31.2% annually over five years. Its debt is well-managed with more cash than total debt and strong short-term asset coverage, while maintaining stable weekly volatility and experienced management and board teams.
- Get an in-depth perspective on Pci Technology GroupLtd's performance by reading our balance sheet health report here.
- Evaluate Pci Technology GroupLtd's historical performance by accessing our past performance report.
China Fangda Group (SZSE:000055)
Simply Wall St Financial Health Rating: ★★★★★☆
Overview: China Fangda Group Co., Ltd. is involved in the production and sales of curtain wall materials in China, with a market cap of CN¥3.23 billion.
Operations: The company has not reported any specific revenue segments.
Market Cap: CN¥3.23B
China Fangda Group Co., Ltd. faces challenges with declining earnings, reporting a net income of CN¥33.03 million for Q1 2025, down from CN¥51.47 million the previous year, and full-year 2024 earnings also fell significantly. Despite stable weekly volatility and satisfactory debt levels, its profit margins have decreased to 3% from last year's 5.8%. The company maintains strong asset coverage over liabilities but struggles with negative earnings growth and reduced dividends recently announced at CNY 0.50 per share for B shares, reflecting ongoing financial pressures amid an experienced management team tenure averaging over two years.
- Jump into the full analysis health report here for a deeper understanding of China Fangda Group.
- Understand China Fangda Group's track record by examining our performance history report.
Zhenjiang Dongfang Electric Heating TechnologyLtd (SZSE:300217)
Simply Wall St Financial Health Rating: ★★★★★★
Overview: Zhenjiang Dongfang Electric Heating Technology Co., Ltd designs, manufactures, and sells various electric heaters in China, with a market cap of CN¥6.23 billion.
Operations: Revenue Segments: The company has not reported any specific revenue segments.
Market Cap: CN¥6.23B
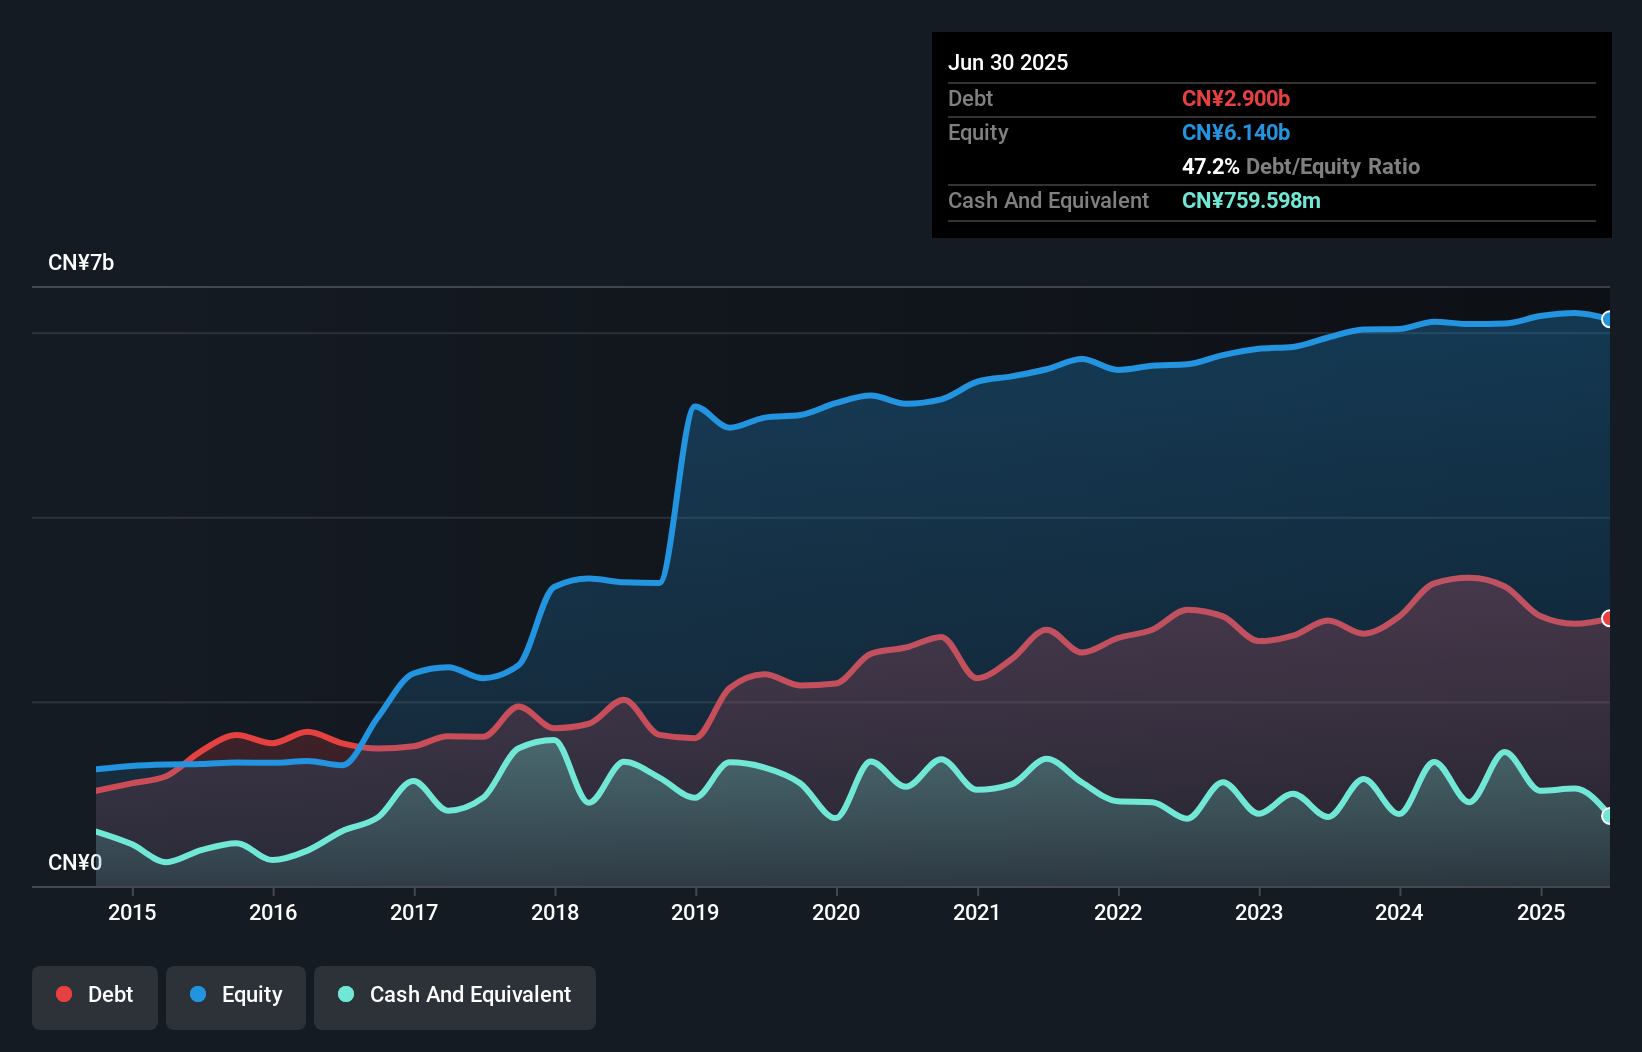
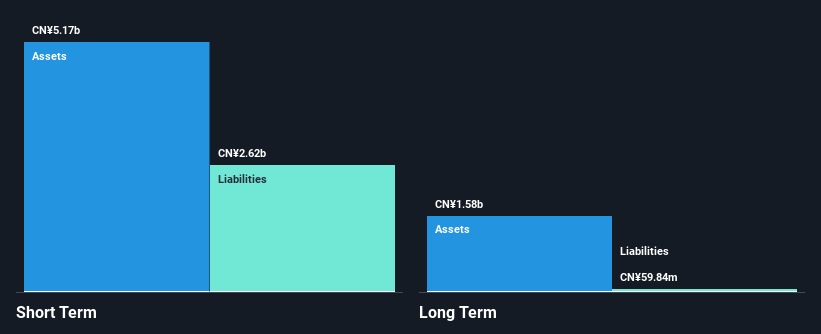
Zhenjiang Dongfang Electric Heating Technology Co., Ltd. has seen a decline in financial performance, with Q1 2025 sales dropping to CN¥683.87 million from CN¥875.59 million the previous year and net income halving to CN¥44.88 million. Despite these challenges, the company maintains strong asset coverage over liabilities and has reduced its debt-to-equity ratio significantly over five years, now holding more cash than total debt. While its dividend yield is not well covered by free cash flows, operating cash flow comfortably covers debt obligations, reflecting prudent financial management amid an experienced leadership team with an average tenure of 10.3 years.
- Take a closer look at Zhenjiang Dongfang Electric Heating TechnologyLtd's potential here in our financial health report.
- Gain insights into Zhenjiang Dongfang Electric Heating TechnologyLtd's past trends and performance with our report on the company's historical track record.
Turning Ideas Into Actions
- Access the full spectrum of 5,607 Global Penny Stocks by clicking on this link.
- Contemplating Other Strategies? Rare earth metals are the new gold rush. Find out which 23 stocks are leading the charge.
This article by Simply Wall St is general in nature. We provide commentary based on historical data and analyst forecasts only using an unbiased methodology and our articles are not intended to be financial advice. It does not constitute a recommendation to buy or sell any stock, and does not take account of your objectives, or your financial situation. We aim to bring you long-term focused analysis driven by fundamental data. Note that our analysis may not factor in the latest price-sensitive company announcements or qualitative material. Simply Wall St has no position in any stocks mentioned.
If you're looking to trade China Fangda Group, open an account with the lowest-cost platform trusted by professionals, Interactive Brokers.
With clients in over 200 countries and territories, and access to 160 markets, IBKR lets you trade stocks, options, futures, forex, bonds and funds from a single integrated account.
Enjoy no hidden fees, no account minimums, and FX conversion rates as low as 0.03%, far better than what most brokers offer.
Sponsored ContentNew: AI Stock Screener & Alerts
Our new AI Stock Screener scans the market every day to uncover opportunities.
• Dividend Powerhouses (3%+ Yield)
• Undervalued Small Caps with Insider Buying
• High growth Tech and AI Companies
Or build your own from over 50 metrics.
Have feedback on this article? Concerned about the content? Get in touch with us directly. Alternatively, email editorial-team@simplywallst.com
About SZSE:000055
China Fangda Group
Engages in the production and sales of curtain wall materials in China.
Excellent balance sheet average dividend payer.
Market Insights

Community Narratives

