
Advertisement
Wuhan Yifi Laser Corporation Limited (SHSE:688646) Soars 28% But It's A Story Of Risk Vs Reward
Wuhan Yifi Laser Corporation Limited (SHSE:688646) shareholders are no doubt pleased to see that the share price has bounced 28% in the last month, although it is still struggling to make up recently lost ground. Longer-term shareholders would be thankful for the recovery in the share price since it's now virtually flat for the year after the recent bounce.
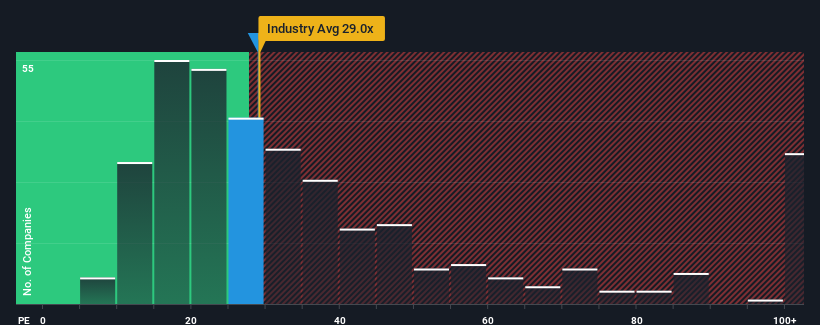
Even after such a large jump in price, it's still not a stretch to say that Wuhan Yifi Laser's price-to-earnings (or "P/E") ratio of 28.9x right now seems quite "middle-of-the-road" compared to the market in China, where the median P/E ratio is around 30x. While this might not raise any eyebrows, if the P/E ratio is not justified investors could be missing out on a potential opportunity or ignoring looming disappointment.
For example, consider that Wuhan Yifi Laser's financial performance has been poor lately as its earnings have been in decline. It might be that many expect the company to put the disappointing earnings performance behind them over the coming period, which has kept the P/E from falling. If not, then existing shareholders may be a little nervous about the viability of the share price.
View our latest analysis for Wuhan Yifi Laser
What Are Growth Metrics Telling Us About The P/E?
The only time you'd be comfortable seeing a P/E like Wuhan Yifi Laser's is when the company's growth is tracking the market closely.
If we review the last year of earnings, dishearteningly the company's profits fell to the tune of 4.2%. However, a few very strong years before that means that it was still able to grow EPS by an impressive 444% in total over the last three years. Accordingly, while they would have preferred to keep the run going, shareholders would probably welcome the medium-term rates of earnings growth.
This is in contrast to the rest of the market, which is expected to grow by 41% over the next year, materially lower than the company's recent medium-term annualised growth rates.
With this information, we find it interesting that Wuhan Yifi Laser is trading at a fairly similar P/E to the market. It may be that most investors are not convinced the company can maintain its recent growth rates.
The Key Takeaway
Its shares have lifted substantially and now Wuhan Yifi Laser's P/E is also back up to the market median. Using the price-to-earnings ratio alone to determine if you should sell your stock isn't sensible, however it can be a practical guide to the company's future prospects.
Our examination of Wuhan Yifi Laser revealed its three-year earnings trends aren't contributing to its P/E as much as we would have predicted, given they look better than current market expectations. When we see strong earnings with faster-than-market growth, we assume potential risks are what might be placing pressure on the P/E ratio. At least the risk of a price drop looks to be subdued if recent medium-term earnings trends continue, but investors seem to think future earnings could see some volatility.
A lot of potential risks can sit within a company's balance sheet. You can assess many of the main risks through our free balance sheet analysis for Wuhan Yifi Laser with six simple checks.
It's important to make sure you look for a great company, not just the first idea you come across. So take a peek at this free list of interesting companies with strong recent earnings growth (and a low P/E).
Valuation is complex, but we're here to simplify it.
Discover if Wuhan Yifi Laser might be undervalued or overvalued with our detailed analysis, featuring fair value estimates, potential risks, dividends, insider trades, and its financial condition.
Access Free AnalysisHave feedback on this article? Concerned about the content? Get in touch with us directly. Alternatively, email editorial-team (at) simplywallst.com.
This article by Simply Wall St is general in nature. We provide commentary based on historical data and analyst forecasts only using an unbiased methodology and our articles are not intended to be financial advice. It does not constitute a recommendation to buy or sell any stock, and does not take account of your objectives, or your financial situation. We aim to bring you long-term focused analysis driven by fundamental data. Note that our analysis may not factor in the latest price-sensitive company announcements or qualitative material. Simply Wall St has no position in any stocks mentioned.
About SHSE:688646
Wuhan Yifi Laser
Researches, develops, designs, manufactures, and sells precision welding equipment and automated products.
Mediocre balance sheet and slightly overvalued.
Market Insights

Advertisement
Community Narratives
America Wants Homegrown Drones — Draganfly Is Ready to Deliver
Fair Value US$9.21|33.8% undervalued
JO
Community Contributor
Cheesecake Factory offers an enticing opportunity for long-term growth by leveraging new concepts
Fair Value US$73.83|26.3% undervalued
ZW
Community Contributor
Coca-Cola’s Intrinsic Value Set to Rise with Fed Rate Cut
Fair Value US$67.50|1.2% undervalued
AL
Community Contributor
Fully Permitted Gold Mine with 50 Baggers Potential 
Fair Value CA$41.00|98.6% undervalued
RO
Community Contributor