
Advertisement
- China
- /
- Aerospace & Defense
- /
- SHSE:688311
Revenues Tell The Story For Chengdu M&S Electronics Technology Co.,Ltd. (SHSE:688311) As Its Stock Soars 27%
Chengdu M&S Electronics Technology Co.,Ltd. (SHSE:688311) shareholders are no doubt pleased to see that the share price has bounced 27% in the last month, although it is still struggling to make up recently lost ground. Not all shareholders will be feeling jubilant, since the share price is still down a very disappointing 34% in the last twelve months.
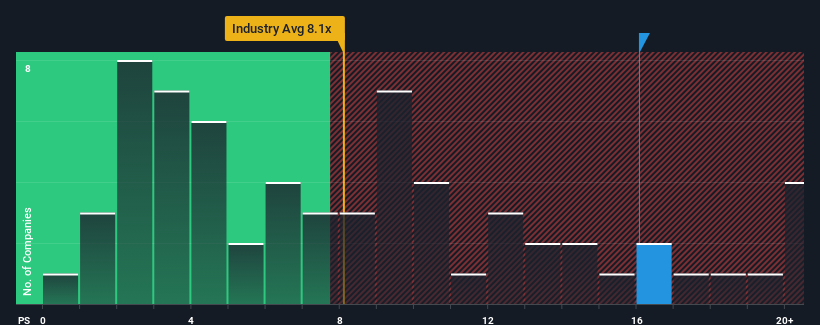
After such a large jump in price, Chengdu M&S Electronics TechnologyLtd may be sending very bearish signals at the moment with a price-to-sales (or "P/S") ratio of 16.1x, since almost half of all companies in the Aerospace & Defense industry in China have P/S ratios under 8.1x and even P/S lower than 3x are not unusual. Nonetheless, we'd need to dig a little deeper to determine if there is a rational basis for the highly elevated P/S.
Check out our latest analysis for Chengdu M&S Electronics TechnologyLtd
What Does Chengdu M&S Electronics TechnologyLtd's P/S Mean For Shareholders?
Chengdu M&S Electronics TechnologyLtd hasn't been tracking well recently as its declining revenue compares poorly to other companies, which have seen some growth in their revenues on average. One possibility is that the P/S ratio is high because investors think this poor revenue performance will turn the corner. You'd really hope so, otherwise you're paying a pretty hefty price for no particular reason.
If you'd like to see what analysts are forecasting going forward, you should check out our free report on Chengdu M&S Electronics TechnologyLtd.What Are Revenue Growth Metrics Telling Us About The High P/S?
There's an inherent assumption that a company should far outperform the industry for P/S ratios like Chengdu M&S Electronics TechnologyLtd's to be considered reasonable.
In reviewing the last year of financials, we were disheartened to see the company's revenues fell to the tune of 30%. This means it has also seen a slide in revenue over the longer-term as revenue is down 21% in total over the last three years. Therefore, it's fair to say the revenue growth recently has been undesirable for the company.
Shifting to the future, estimates from the dual analysts covering the company suggest revenue should grow by 261% over the next year. That's shaping up to be materially higher than the 48% growth forecast for the broader industry.
In light of this, it's understandable that Chengdu M&S Electronics TechnologyLtd's P/S sits above the majority of other companies. Apparently shareholders aren't keen to offload something that is potentially eyeing a more prosperous future.
The Key Takeaway
Chengdu M&S Electronics TechnologyLtd's P/S has grown nicely over the last month thanks to a handy boost in the share price. Typically, we'd caution against reading too much into price-to-sales ratios when settling on investment decisions, though it can reveal plenty about what other market participants think about the company.
Our look into Chengdu M&S Electronics TechnologyLtd shows that its P/S ratio remains high on the merit of its strong future revenues. At this stage investors feel the potential for a deterioration in revenues is quite remote, justifying the elevated P/S ratio. It's hard to see the share price falling strongly in the near future under these circumstances.
Don't forget that there may be other risks. For instance, we've identified 1 warning sign for Chengdu M&S Electronics TechnologyLtd that you should be aware of.
Of course, profitable companies with a history of great earnings growth are generally safer bets. So you may wish to see this free collection of other companies that have reasonable P/E ratios and have grown earnings strongly.
New: AI Stock Screener & Alerts
Our new AI Stock Screener scans the market every day to uncover opportunities.
• Dividend Powerhouses (3%+ Yield)
• Undervalued Small Caps with Insider Buying
• High growth Tech and AI Companies
Or build your own from over 50 metrics.
Have feedback on this article? Concerned about the content? Get in touch with us directly. Alternatively, email editorial-team (at) simplywallst.com.
This article by Simply Wall St is general in nature. We provide commentary based on historical data and analyst forecasts only using an unbiased methodology and our articles are not intended to be financial advice. It does not constitute a recommendation to buy or sell any stock, and does not take account of your objectives, or your financial situation. We aim to bring you long-term focused analysis driven by fundamental data. Note that our analysis may not factor in the latest price-sensitive company announcements or qualitative material. Simply Wall St has no position in any stocks mentioned.
About SHSE:688311
Chengdu M&S Electronics TechnologyLtd
Chengdu M&S Electronics Technology Co.,Ltd.
High growth potential with excellent balance sheet.
Market Insights

Advertisement
Weekly Picks
RO


RockeTeller on Santacruz Silver Mining ·
Crazy Undervalued 42 Baggers Silver Play (Active & Running Mine)
Fair Value:CA$8696.4% undervalued
41 followersusers have followed this narrative
6 commentsusers have commented on this narrative
14 likesusers have liked this narrative
RO


Robbo on Fiducian Group ·
Fiducian: Compliance Clouds or Value Opportunity?
Fair Value:AU$123.8% undervalued
5 followersusers have followed this narrative
0 commentsusers have commented on this narrative
0 likesusers have liked this narrative
WO

woodworthfund on Willamette Valley Vineyards ·
Willamette Valley Vineyards (WVVI): Not-So-Great Value
Fair Value:US$244.5% overvalued
7 followersusers have followed this narrative
0 commentsusers have commented on this narrative
1 likeusers have liked this narrative
Recently Updated Narratives
SC

scm on Text ·
TXT will see revenue grow 26% with a profit margin boost of almost 40%
Fair Value:zł8048.3% undervalued
2 followersusers have followed this narrative
0 commentsusers have commented on this narrative
0 likesusers have liked this narrative
VL

Vladislav on Galleon Gold ·
Significantly undervalued gold explorer in Timmins, finally getting traction
Fair Value:CA$482.9% undervalued
2 followersusers have followed this narrative
0 commentsusers have commented on this narrative
0 likesusers have liked this narrative
FU

FundamentallySarcastic on Credit Corp Group ·
Moderation and Stabilisation: HOLD: Fair Price based on a 4-year Cycle is $12.08
Fair Value:AU$12.6411.8% overvalued
3 followersusers have followed this narrative
0 commentsusers have commented on this narrative
0 likesusers have liked this narrative
Popular Narratives
TH


TheWallstreetKing on MicroVision ·
MicroVision will explode future revenue by 380.37% with a vision towards success
Fair Value:US$6098.5% undervalued
116 followersusers have followed this narrative
11 commentsusers have commented on this narrative
22 likesusers have liked this narrative
AN


AnalystConsensusTarget on NVIDIA ·
NVDA: Expanding AI Demand Will Drive Major Data Center Investments Through 2026
Fair Value:US$250.3928.3% undervalued
955 followersusers have followed this narrative
6 commentsusers have commented on this narrative
25 likesusers have liked this narrative
OS


oscargarcia on Alphabet ·
The company that turned a verb into a global necessity and basically runs the modern internet, digital ads, smartphones, maps, and AI.
Fair Value:US$3406.0% undervalued
147 followersusers have followed this narrative
6 commentsusers have commented on this narrative
18 likesusers have liked this narrative

