
Advertisement
- China
- /
- Construction
- /
- SHSE:603887
Shanghai CDXJ Digital Technology Co.,LTD.'s (SHSE:603887) Shares Climb 29% But Its Business Is Yet to Catch Up

Shanghai CDXJ Digital Technology Co.,LTD. (SHSE:603887) shareholders are no doubt pleased to see that the share price has bounced 29% in the last month, although it is still struggling to make up recently lost ground. Not all shareholders will be feeling jubilant, since the share price is still down a very disappointing 36% in the last twelve months.
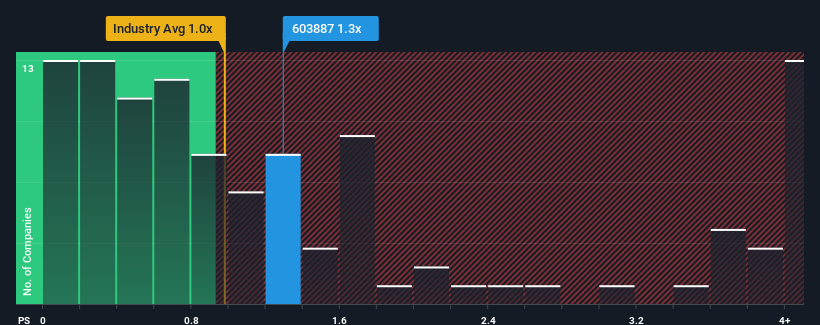
In spite of the firm bounce in price, it's still not a stretch to say that Shanghai CDXJ Digital TechnologyLTD's price-to-sales (or "P/S") ratio of 1.3x right now seems quite "middle-of-the-road" compared to the Construction industry in China, where the median P/S ratio is around 1x. While this might not raise any eyebrows, if the P/S ratio is not justified investors could be missing out on a potential opportunity or ignoring looming disappointment.
Check out our latest analysis for Shanghai CDXJ Digital TechnologyLTD
How Shanghai CDXJ Digital TechnologyLTD Has Been Performing
As an illustration, revenue has deteriorated at Shanghai CDXJ Digital TechnologyLTD over the last year, which is not ideal at all. One possibility is that the P/S is moderate because investors think the company might still do enough to be in line with the broader industry in the near future. If you like the company, you'd at least be hoping this is the case so that you could potentially pick up some stock while it's not quite in favour.
Although there are no analyst estimates available for Shanghai CDXJ Digital TechnologyLTD, take a look at this free data-rich visualisation to see how the company stacks up on earnings, revenue and cash flow.Do Revenue Forecasts Match The P/S Ratio?
There's an inherent assumption that a company should be matching the industry for P/S ratios like Shanghai CDXJ Digital TechnologyLTD's to be considered reasonable.
Retrospectively, the last year delivered a frustrating 22% decrease to the company's top line. The last three years don't look nice either as the company has shrunk revenue by 48% in aggregate. Therefore, it's fair to say the revenue growth recently has been undesirable for the company.
Comparing that to the industry, which is predicted to deliver 13% growth in the next 12 months, the company's downward momentum based on recent medium-term revenue results is a sobering picture.
With this in mind, we find it worrying that Shanghai CDXJ Digital TechnologyLTD's P/S exceeds that of its industry peers. It seems most investors are ignoring the recent poor growth rate and are hoping for a turnaround in the company's business prospects. There's a good chance existing shareholders are setting themselves up for future disappointment if the P/S falls to levels more in line with the recent negative growth rates.
What Does Shanghai CDXJ Digital TechnologyLTD's P/S Mean For Investors?
Its shares have lifted substantially and now Shanghai CDXJ Digital TechnologyLTD's P/S is back within range of the industry median. We'd say the price-to-sales ratio's power isn't primarily as a valuation instrument but rather to gauge current investor sentiment and future expectations.
Our look at Shanghai CDXJ Digital TechnologyLTD revealed its shrinking revenues over the medium-term haven't impacted the P/S as much as we anticipated, given the industry is set to grow. When we see revenue heading backwards in the context of growing industry forecasts, it'd make sense to expect a possible share price decline on the horizon, sending the moderate P/S lower. Unless the recent medium-term conditions improve markedly, investors will have a hard time accepting the share price as fair value.
You should always think about risks. Case in point, we've spotted 4 warning signs for Shanghai CDXJ Digital TechnologyLTD you should be aware of, and 1 of them makes us a bit uncomfortable.
If companies with solid past earnings growth is up your alley, you may wish to see this free collection of other companies with strong earnings growth and low P/E ratios.
New: Manage All Your Stock Portfolios in One Place
We've created the ultimate portfolio companion for stock investors, and it's free.
• Connect an unlimited number of Portfolios and see your total in one currency
• Be alerted to new Warning Signs or Risks via email or mobile
• Track the Fair Value of your stocks
Have feedback on this article? Concerned about the content? Get in touch with us directly. Alternatively, email editorial-team (at) simplywallst.com.
This article by Simply Wall St is general in nature. We provide commentary based on historical data and analyst forecasts only using an unbiased methodology and our articles are not intended to be financial advice. It does not constitute a recommendation to buy or sell any stock, and does not take account of your objectives, or your financial situation. We aim to bring you long-term focused analysis driven by fundamental data. Note that our analysis may not factor in the latest price-sensitive company announcements or qualitative material. Simply Wall St has no position in any stocks mentioned.
Have feedback on this article? Concerned about the content? Get in touch with us directly. Alternatively, email editorial-team@simplywallst.com
About SHSE:603887
Shanghai CDXJ Digital TechnologyLTD
Engages in the cloud infrastructure, cloud data service, and geotechnical engineering businesses in China.
Adequate balance sheet low.
Market Insights

Advertisement
Community Narratives
Scaling up in building materials with smart M&A and growing profitability
Fair Value US$2.77|30.0% undervalued
CM
Community Contributor
Hims: The Platform Powering Personalised Healthcare
Fair Value US$114.01|51.9% undervalued
BL
Community Contributor
Undervalued lottery company with strong fundamentals
Fair Value AU$15.00|34.5% undervalued
RO
Community Contributor
Proximus, transferring money from the impatient to the patient investor
Fair Value €16.62|55.1% undervalued
AX
Community Contributor