The Market Lifts Nancal Technology Co.,Ltd (SHSE:603859) Shares 44% But It Can Do More

Nancal Technology Co.,Ltd (SHSE:603859) shareholders would be excited to see that the share price has had a great month, posting a 44% gain and recovering from prior weakness. Not all shareholders will be feeling jubilant, since the share price is still down a very disappointing 27% in the last twelve months.
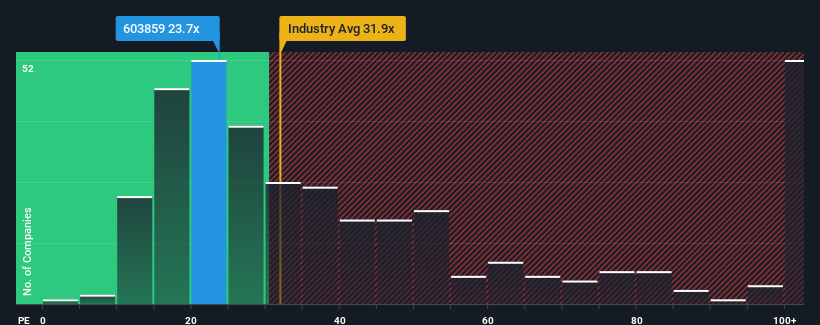
Although its price has surged higher, Nancal TechnologyLtd may still be sending bullish signals at the moment with its price-to-earnings (or "P/E") ratio of 23.7x, since almost half of all companies in China have P/E ratios greater than 34x and even P/E's higher than 64x are not unusual. Nonetheless, we'd need to dig a little deeper to determine if there is a rational basis for the reduced P/E.
Recent times haven't been advantageous for Nancal TechnologyLtd as its earnings have been falling quicker than most other companies. The P/E is probably low because investors think this poor earnings performance isn't going to improve at all. You'd much rather the company wasn't bleeding earnings if you still believe in the business. If not, then existing shareholders will probably struggle to get excited about the future direction of the share price.
See our latest analysis for Nancal TechnologyLtd

What Are Growth Metrics Telling Us About The Low P/E?
In order to justify its P/E ratio, Nancal TechnologyLtd would need to produce sluggish growth that's trailing the market.
Retrospectively, the last year delivered a frustrating 12% decrease to the company's bottom line. However, a few very strong years before that means that it was still able to grow EPS by an impressive 33% in total over the last three years. So we can start by confirming that the company has generally done a very good job of growing earnings over that time, even though it had some hiccups along the way.
Looking ahead now, EPS is anticipated to climb by 29% per year during the coming three years according to the three analysts following the company. Meanwhile, the rest of the market is forecast to only expand by 19% each year, which is noticeably less attractive.
In light of this, it's peculiar that Nancal TechnologyLtd's P/E sits below the majority of other companies. It looks like most investors are not convinced at all that the company can achieve future growth expectations.
What We Can Learn From Nancal TechnologyLtd's P/E?
Nancal TechnologyLtd's stock might have been given a solid boost, but its P/E certainly hasn't reached any great heights. While the price-to-earnings ratio shouldn't be the defining factor in whether you buy a stock or not, it's quite a capable barometer of earnings expectations.
Our examination of Nancal TechnologyLtd's analyst forecasts revealed that its superior earnings outlook isn't contributing to its P/E anywhere near as much as we would have predicted. There could be some major unobserved threats to earnings preventing the P/E ratio from matching the positive outlook. It appears many are indeed anticipating earnings instability, because these conditions should normally provide a boost to the share price.
Many other vital risk factors can be found on the company's balance sheet. Our free balance sheet analysis for Nancal TechnologyLtd with six simple checks will allow you to discover any risks that could be an issue.
Of course, you might find a fantastic investment by looking at a few good candidates. So take a peek at this free list of companies with a strong growth track record, trading on a low P/E.
Valuation is complex, but we're here to simplify it.
Discover if Nancal TechnologyLtd might be undervalued or overvalued with our detailed analysis, featuring fair value estimates, potential risks, dividends, insider trades, and its financial condition.
Access Free AnalysisHave feedback on this article? Concerned about the content? Get in touch with us directly. Alternatively, email editorial-team (at) simplywallst.com.
This article by Simply Wall St is general in nature. We provide commentary based on historical data and analyst forecasts only using an unbiased methodology and our articles are not intended to be financial advice. It does not constitute a recommendation to buy or sell any stock, and does not take account of your objectives, or your financial situation. We aim to bring you long-term focused analysis driven by fundamental data. Note that our analysis may not factor in the latest price-sensitive company announcements or qualitative material. Simply Wall St has no position in any stocks mentioned.
About SHSE:603859
Nancal TechnologyLtd
Provides digital transformation solutions in China and internationally.
Excellent balance sheet and good value.
Market Insights
Community Narratives


