Investors Give Nancal Technology Co.,Ltd (SHSE:603859) Shares A 25% Hiding


Nancal Technology Co.,Ltd (SHSE:603859) shares have had a horrible month, losing 25% after a relatively good period beforehand. Instead of being rewarded, shareholders who have already held through the last twelve months are now sitting on a 30% share price drop.
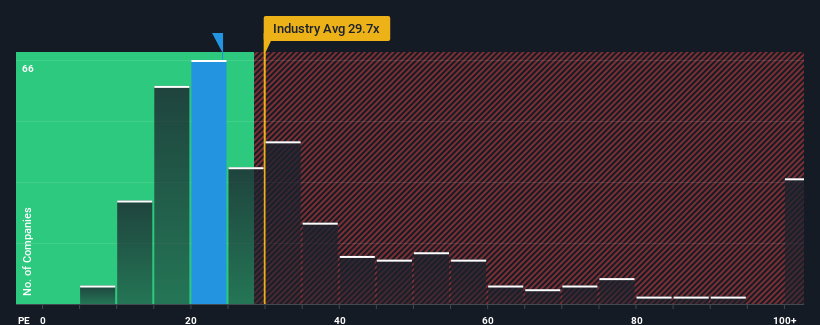
Although its price has dipped substantially, Nancal TechnologyLtd's price-to-earnings (or "P/E") ratio of 24.1x might still make it look like a buy right now compared to the market in China, where around half of the companies have P/E ratios above 30x and even P/E's above 53x are quite common. Nonetheless, we'd need to dig a little deeper to determine if there is a rational basis for the reduced P/E.
Recent times have been advantageous for Nancal TechnologyLtd as its earnings have been rising faster than most other companies. It might be that many expect the strong earnings performance to degrade substantially, which has repressed the P/E. If you like the company, you'd be hoping this isn't the case so that you could potentially pick up some stock while it's out of favour.
View our latest analysis for Nancal TechnologyLtd
What Are Growth Metrics Telling Us About The Low P/E?
There's an inherent assumption that a company should underperform the market for P/E ratios like Nancal TechnologyLtd's to be considered reasonable.
Retrospectively, the last year delivered a decent 11% gain to the company's bottom line. The latest three year period has also seen an excellent 54% overall rise in EPS, aided somewhat by its short-term performance. Therefore, it's fair to say the earnings growth recently has been superb for the company.
Looking ahead now, EPS is anticipated to climb by 33% per year during the coming three years according to the four analysts following the company. That's shaping up to be materially higher than the 21% each year growth forecast for the broader market.
In light of this, it's peculiar that Nancal TechnologyLtd's P/E sits below the majority of other companies. It looks like most investors are not convinced at all that the company can achieve future growth expectations.
What We Can Learn From Nancal TechnologyLtd's P/E?
The softening of Nancal TechnologyLtd's shares means its P/E is now sitting at a pretty low level. While the price-to-earnings ratio shouldn't be the defining factor in whether you buy a stock or not, it's quite a capable barometer of earnings expectations.
We've established that Nancal TechnologyLtd currently trades on a much lower than expected P/E since its forecast growth is higher than the wider market. When we see a strong earnings outlook with faster-than-market growth, we assume potential risks are what might be placing significant pressure on the P/E ratio. At least price risks look to be very low, but investors seem to think future earnings could see a lot of volatility.
A lot of potential risks can sit within a company's balance sheet. Take a look at our free balance sheet analysis for Nancal TechnologyLtd with six simple checks on some of these key factors.
If you're unsure about the strength of Nancal TechnologyLtd's business, why not explore our interactive list of stocks with solid business fundamentals for some other companies you may have missed.
If you're looking to trade Nancal TechnologyLtd, open an account with the lowest-cost platform trusted by professionals, Interactive Brokers.
With clients in over 200 countries and territories, and access to 160 markets, IBKR lets you trade stocks, options, futures, forex, bonds and funds from a single integrated account.
Enjoy no hidden fees, no account minimums, and FX conversion rates as low as 0.03%, far better than what most brokers offer.
Sponsored ContentValuation is complex, but we're here to simplify it.
Discover if Nancal TechnologyLtd might be undervalued or overvalued with our detailed analysis, featuring fair value estimates, potential risks, dividends, insider trades, and its financial condition.
Access Free AnalysisHave feedback on this article? Concerned about the content? Get in touch with us directly. Alternatively, email editorial-team (at) simplywallst.com.
This article by Simply Wall St is general in nature. We provide commentary based on historical data and analyst forecasts only using an unbiased methodology and our articles are not intended to be financial advice. It does not constitute a recommendation to buy or sell any stock, and does not take account of your objectives, or your financial situation. We aim to bring you long-term focused analysis driven by fundamental data. Note that our analysis may not factor in the latest price-sensitive company announcements or qualitative material. Simply Wall St has no position in any stocks mentioned.
About SHSE:603859
Nancal TechnologyLtd
Provides digital transformation solutions in China and internationally.
Excellent balance sheet and good value.
Market Insights

Community Narratives


