
Advertisement
- China
- /
- Electrical
- /
- SHSE:603628
Some Clenergy Technology Co., Ltd. (SHSE:603628) Shareholders Look For Exit As Shares Take 31% Pounding

Clenergy Technology Co., Ltd. (SHSE:603628) shares have had a horrible month, losing 31% after a relatively good period beforehand. The drop over the last 30 days has capped off a tough year for shareholders, with the share price down 19% in that time.
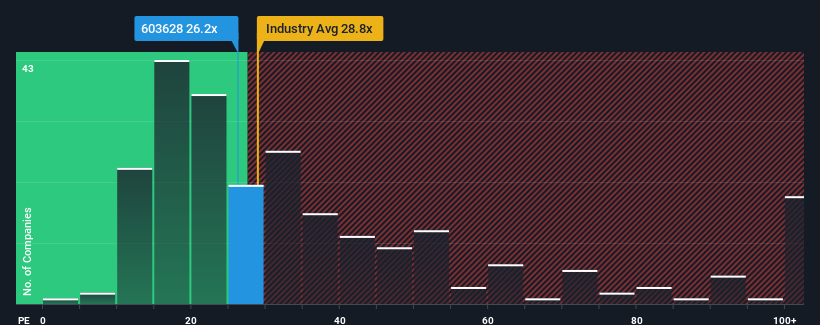
Even after such a large drop in price, it's still not a stretch to say that Clenergy Technology's price-to-earnings (or "P/E") ratio of 26.2x right now seems quite "middle-of-the-road" compared to the market in China, where the median P/E ratio is around 28x. However, investors might be overlooking a clear opportunity or potential setback if there is no rational basis for the P/E.
As an illustration, earnings have deteriorated at Clenergy Technology over the last year, which is not ideal at all. It might be that many expect the company to put the disappointing earnings performance behind them over the coming period, which has kept the P/E from falling. If you like the company, you'd at least be hoping this is the case so that you could potentially pick up some stock while it's not quite in favour.
See our latest analysis for Clenergy Technology
Does Growth Match The P/E?
In order to justify its P/E ratio, Clenergy Technology would need to produce growth that's similar to the market.
Taking a look back first, the company's earnings per share growth last year wasn't something to get excited about as it posted a disappointing decline of 15%. Even so, admirably EPS has lifted 74% in aggregate from three years ago, notwithstanding the last 12 months. So we can start by confirming that the company has generally done a very good job of growing earnings over that time, even though it had some hiccups along the way.
Comparing that to the market, which is predicted to deliver 36% growth in the next 12 months, the company's momentum is weaker based on recent medium-term annualised earnings results.
With this information, we find it interesting that Clenergy Technology is trading at a fairly similar P/E to the market. Apparently many investors in the company are less bearish than recent times would indicate and aren't willing to let go of their stock right now. Maintaining these prices will be difficult to achieve as a continuation of recent earnings trends is likely to weigh down the shares eventually.
What We Can Learn From Clenergy Technology's P/E?
Following Clenergy Technology's share price tumble, its P/E is now hanging on to the median market P/E. Generally, our preference is to limit the use of the price-to-earnings ratio to establishing what the market thinks about the overall health of a company.
Our examination of Clenergy Technology revealed its three-year earnings trends aren't impacting its P/E as much as we would have predicted, given they look worse than current market expectations. When we see weak earnings with slower than market growth, we suspect the share price is at risk of declining, sending the moderate P/E lower. Unless the recent medium-term conditions improve, it's challenging to accept these prices as being reasonable.
There are also other vital risk factors to consider and we've discovered 4 warning signs for Clenergy Technology (1 makes us a bit uncomfortable!) that you should be aware of before investing here.
Of course, you might also be able to find a better stock than Clenergy Technology. So you may wish to see this free collection of other companies that have reasonable P/E ratios and have grown earnings strongly.
New: AI Stock Screener & Alerts
Our new AI Stock Screener scans the market every day to uncover opportunities.
• Dividend Powerhouses (3%+ Yield)
• Undervalued Small Caps with Insider Buying
• High growth Tech and AI Companies
Or build your own from over 50 metrics.
Have feedback on this article? Concerned about the content? Get in touch with us directly. Alternatively, email editorial-team (at) simplywallst.com.
This article by Simply Wall St is general in nature. We provide commentary based on historical data and analyst forecasts only using an unbiased methodology and our articles are not intended to be financial advice. It does not constitute a recommendation to buy or sell any stock, and does not take account of your objectives, or your financial situation. We aim to bring you long-term focused analysis driven by fundamental data. Note that our analysis may not factor in the latest price-sensitive company announcements or qualitative material. Simply Wall St has no position in any stocks mentioned.
Have feedback on this article? Concerned about the content? Get in touch with us directly. Alternatively, email editorial-team@simplywallst.com
About SHSE:603628
Clenergy Technology
Engages in the development, manufacturing, and engineering of solar mounting and cable management gear products in China and internationally.
Flawless balance sheet and slightly overvalued.
Market Insights

Advertisement
Community Narratives

Apple: A Dying Star with an Overpriced Valuation
Fair Value US$177.34|20.1% overvalued
IN
Community Contributor
Avino a case for USD$20 per share within 5 years (assuming $3,500 gold, $100 silver and $4 copper).
Fair Value CA$26.79|87.5% undervalued
AG
Community Contributor
Riding the Defense Boom RENK Sees Revenue Climb at 15% CAGR by FY 2029
Fair Value €69.87|24.5% undervalued
CH
Community Contributor