Risks Still Elevated At These Prices As AA Industrial Belting (Shanghai) Co.,Ltd (SHSE:603580) Shares Dive 35%


AA Industrial Belting (Shanghai) Co.,Ltd (SHSE:603580) shares have retraced a considerable 35% in the last month, reversing a fair amount of their solid recent performance. Still, a bad month hasn't completely ruined the past year with the stock gaining 56%, which is great even in a bull market.
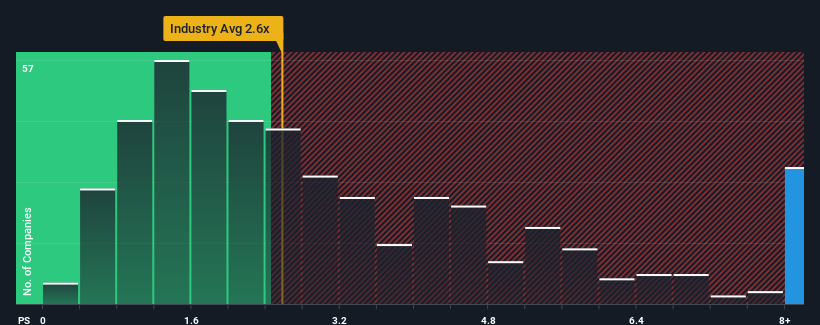
Although its price has dipped substantially, given around half the companies in China's Machinery industry have price-to-sales ratios (or "P/S") below 2.6x, you may still consider AA Industrial Belting (Shanghai)Ltd as a stock to avoid entirely with its 18.3x P/S ratio. Although, it's not wise to just take the P/S at face value as there may be an explanation why it's so lofty.
See our latest analysis for AA Industrial Belting (Shanghai)Ltd
What Does AA Industrial Belting (Shanghai)Ltd's P/S Mean For Shareholders?
For example, consider that AA Industrial Belting (Shanghai)Ltd's financial performance has been poor lately as its revenue has been in decline. One possibility is that the P/S is high because investors think the company will still do enough to outperform the broader industry in the near future. However, if this isn't the case, investors might get caught out paying too much for the stock.
Want the full picture on earnings, revenue and cash flow for the company? Then our free report on AA Industrial Belting (Shanghai)Ltd will help you shine a light on its historical performance.Do Revenue Forecasts Match The High P/S Ratio?
The only time you'd be truly comfortable seeing a P/S as steep as AA Industrial Belting (Shanghai)Ltd's is when the company's growth is on track to outshine the industry decidedly.
In reviewing the last year of financials, we were disheartened to see the company's revenues fell to the tune of 19%. As a result, revenue from three years ago have also fallen 24% overall. Therefore, it's fair to say the revenue growth recently has been undesirable for the company.
Weighing that medium-term revenue trajectory against the broader industry's one-year forecast for expansion of 24% shows it's an unpleasant look.
With this information, we find it concerning that AA Industrial Belting (Shanghai)Ltd is trading at a P/S higher than the industry. Apparently many investors in the company are way more bullish than recent times would indicate and aren't willing to let go of their stock at any price. There's a very good chance existing shareholders are setting themselves up for future disappointment if the P/S falls to levels more in line with the recent negative growth rates.
What We Can Learn From AA Industrial Belting (Shanghai)Ltd's P/S?
AA Industrial Belting (Shanghai)Ltd's shares may have suffered, but its P/S remains high. While the price-to-sales ratio shouldn't be the defining factor in whether you buy a stock or not, it's quite a capable barometer of revenue expectations.
We've established that AA Industrial Belting (Shanghai)Ltd currently trades on a much higher than expected P/S since its recent revenues have been in decline over the medium-term. When we see revenue heading backwards and underperforming the industry forecasts, we feel the possibility of the share price declining is very real, bringing the P/S back into the realm of reasonability. Should recent medium-term revenue trends persist, it would pose a significant risk to existing shareholders' investments and prospective investors will have a hard time accepting the current value of the stock.
Having said that, be aware AA Industrial Belting (Shanghai)Ltd is showing 2 warning signs in our investment analysis, you should know about.
If strong companies turning a profit tickle your fancy, then you'll want to check out this free list of interesting companies that trade on a low P/E (but have proven they can grow earnings).
If you're looking to trade AA Industrial Belting (Shanghai)Ltd, open an account with the lowest-cost platform trusted by professionals, Interactive Brokers.
With clients in over 200 countries and territories, and access to 160 markets, IBKR lets you trade stocks, options, futures, forex, bonds and funds from a single integrated account.
Enjoy no hidden fees, no account minimums, and FX conversion rates as low as 0.03%, far better than what most brokers offer.
Sponsored ContentNew: Manage All Your Stock Portfolios in One Place
We've created the ultimate portfolio companion for stock investors, and it's free.
• Connect an unlimited number of Portfolios and see your total in one currency
• Be alerted to new Warning Signs or Risks via email or mobile
• Track the Fair Value of your stocks
Have feedback on this article? Concerned about the content? Get in touch with us directly. Alternatively, email editorial-team (at) simplywallst.com.
This article by Simply Wall St is general in nature. We provide commentary based on historical data and analyst forecasts only using an unbiased methodology and our articles are not intended to be financial advice. It does not constitute a recommendation to buy or sell any stock, and does not take account of your objectives, or your financial situation. We aim to bring you long-term focused analysis driven by fundamental data. Note that our analysis may not factor in the latest price-sensitive company announcements or qualitative material. Simply Wall St has no position in any stocks mentioned.
About SHSE:603580
Excellent balance sheet very low.
Market Insights

Community Narratives


