- China
- /
- Electrical
- /
- SHSE:603133
The Market Doesn't Like What It Sees From Tanyuan Technology Co.,Ltd.'s (SHSE:603133) Revenues Yet As Shares Tumble 83%


Tanyuan Technology Co.,Ltd. (SHSE:603133) shareholders that were waiting for something to happen have been dealt a blow with a 83% share price drop in the last month. The recent drop completes a disastrous twelve months for shareholders, who are sitting on a 96% loss during that time.
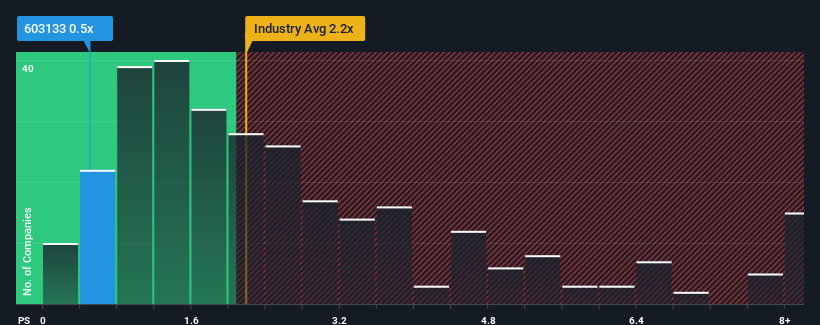
Following the heavy fall in price, it would be understandable if you think Tanyuan TechnologyLtd is a stock with good investment prospects with a price-to-sales ratios (or "P/S") of 0.5x, considering almost half the companies in China's Electrical industry have P/S ratios above 2.2x. Nonetheless, we'd need to dig a little deeper to determine if there is a rational basis for the reduced P/S.
See our latest analysis for Tanyuan TechnologyLtd
How Has Tanyuan TechnologyLtd Performed Recently?
The revenue growth achieved at Tanyuan TechnologyLtd over the last year would be more than acceptable for most companies. It might be that many expect the respectable revenue performance to degrade substantially, which has repressed the P/S. If you like the company, you'd be hoping this isn't the case so that you could potentially pick up some stock while it's out of favour.
Although there are no analyst estimates available for Tanyuan TechnologyLtd, take a look at this free data-rich visualisation to see how the company stacks up on earnings, revenue and cash flow.How Is Tanyuan TechnologyLtd's Revenue Growth Trending?
The only time you'd be truly comfortable seeing a P/S as low as Tanyuan TechnologyLtd's is when the company's growth is on track to lag the industry.
Retrospectively, the last year delivered an exceptional 19% gain to the company's top line. Despite this strong recent growth, it's still struggling to catch up as its three-year revenue frustratingly shrank by 76% overall. Accordingly, shareholders would have felt downbeat about the medium-term rates of revenue growth.
Comparing that to the industry, which is predicted to deliver 24% growth in the next 12 months, the company's downward momentum based on recent medium-term revenue results is a sobering picture.
With this in mind, we understand why Tanyuan TechnologyLtd's P/S is lower than most of its industry peers. Nonetheless, there's no guarantee the P/S has reached a floor yet with revenue going in reverse. There's potential for the P/S to fall to even lower levels if the company doesn't improve its top-line growth.
What Does Tanyuan TechnologyLtd's P/S Mean For Investors?
The southerly movements of Tanyuan TechnologyLtd's shares means its P/S is now sitting at a pretty low level. Using the price-to-sales ratio alone to determine if you should sell your stock isn't sensible, however it can be a practical guide to the company's future prospects.
It's no surprise that Tanyuan TechnologyLtd maintains its low P/S off the back of its sliding revenue over the medium-term. At this stage investors feel the potential for an improvement in revenue isn't great enough to justify a higher P/S ratio. Unless the recent medium-term conditions improve, they will continue to form a barrier for the share price around these levels.
There are also other vital risk factors to consider before investing and we've discovered 4 warning signs for Tanyuan TechnologyLtd that you should be aware of.
It's important to make sure you look for a great company, not just the first idea you come across. So if growing profitability aligns with your idea of a great company, take a peek at this free list of interesting companies with strong recent earnings growth (and a low P/E).
Valuation is complex, but we're here to simplify it.
Discover if Tanyuan TechnologyLtd might be undervalued or overvalued with our detailed analysis, featuring fair value estimates, potential risks, dividends, insider trades, and its financial condition.
Access Free AnalysisHave feedback on this article? Concerned about the content? Get in touch with us directly. Alternatively, email editorial-team (at) simplywallst.com.
This article by Simply Wall St is general in nature. We provide commentary based on historical data and analyst forecasts only using an unbiased methodology and our articles are not intended to be financial advice. It does not constitute a recommendation to buy or sell any stock, and does not take account of your objectives, or your financial situation. We aim to bring you long-term focused analysis driven by fundamental data. Note that our analysis may not factor in the latest price-sensitive company announcements or qualitative material. Simply Wall St has no position in any stocks mentioned.
About SHSE:603133
Tanyuan TechnologyLtd
Develops, manufactures, and sells thermal conductivity graphite heat dissipation materials in China.
Slightly overvalued with imperfect balance sheet.

