Under The Bonnet, JDM JingDaMachine (Ningbo)Ltd's (SHSE:603088) Returns Look Impressive


If we want to find a potential multi-bagger, often there are underlying trends that can provide clues. One common approach is to try and find a company with returns on capital employed (ROCE) that are increasing, in conjunction with a growing amount of capital employed. Basically this means that a company has profitable initiatives that it can continue to reinvest in, which is a trait of a compounding machine. And in light of that, the trends we're seeing at JDM JingDaMachine (Ningbo)Ltd's (SHSE:603088) look very promising so lets take a look.
Understanding Return On Capital Employed (ROCE)
For those who don't know, ROCE is a measure of a company's yearly pre-tax profit (its return), relative to the capital employed in the business. To calculate this metric for JDM JingDaMachine (Ningbo)Ltd, this is the formula:
Return on Capital Employed = Earnings Before Interest and Tax (EBIT) ÷ (Total Assets - Current Liabilities)
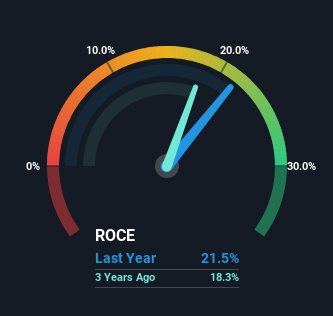
0.21 = CN¥162m ÷ (CN¥1.4b - CN¥598m) (Based on the trailing twelve months to September 2024).
So, JDM JingDaMachine (Ningbo)Ltd has an ROCE of 21%. That's a fantastic return and not only that, it outpaces the average of 5.3% earned by companies in a similar industry.
Check out our latest analysis for JDM JingDaMachine (Ningbo)Ltd
While the past is not representative of the future, it can be helpful to know how a company has performed historically, which is why we have this chart above. If you're interested in investigating JDM JingDaMachine (Ningbo)Ltd's past further, check out this free graph covering JDM JingDaMachine (Ningbo)Ltd's past earnings, revenue and cash flow.
What Does the ROCE Trend For JDM JingDaMachine (Ningbo)Ltd Tell Us?
Investors would be pleased with what's happening at JDM JingDaMachine (Ningbo)Ltd. Over the last five years, returns on capital employed have risen substantially to 21%. The amount of capital employed has increased too, by 39%. So we're very much inspired by what we're seeing at JDM JingDaMachine (Ningbo)Ltd thanks to its ability to profitably reinvest capital.
For the record though, there was a noticeable increase in the company's current liabilities over the period, so we would attribute some of the ROCE growth to that. The current liabilities has increased to 44% of total assets, so the business is now more funded by the likes of its suppliers or short-term creditors. And with current liabilities at those levels, that's pretty high.
In Conclusion...
In summary, it's great to see that JDM JingDaMachine (Ningbo)Ltd can compound returns by consistently reinvesting capital at increasing rates of return, because these are some of the key ingredients of those highly sought after multi-baggers. And with the stock having performed exceptionally well over the last five years, these patterns are being accounted for by investors. With that being said, we still think the promising fundamentals mean the company deserves some further due diligence.
Like most companies, JDM JingDaMachine (Ningbo)Ltd does come with some risks, and we've found 2 warning signs that you should be aware of.
If you want to search for more stocks that have been earning high returns, check out this free list of stocks with solid balance sheets that are also earning high returns on equity.
New: Manage All Your Stock Portfolios in One Place
We've created the ultimate portfolio companion for stock investors, and it's free.
• Connect an unlimited number of Portfolios and see your total in one currency
• Be alerted to new Warning Signs or Risks via email or mobile
• Track the Fair Value of your stocks
Have feedback on this article? Concerned about the content? Get in touch with us directly. Alternatively, email editorial-team (at) simplywallst.com.
This article by Simply Wall St is general in nature. We provide commentary based on historical data and analyst forecasts only using an unbiased methodology and our articles are not intended to be financial advice. It does not constitute a recommendation to buy or sell any stock, and does not take account of your objectives, or your financial situation. We aim to bring you long-term focused analysis driven by fundamental data. Note that our analysis may not factor in the latest price-sensitive company announcements or qualitative material. Simply Wall St has no position in any stocks mentioned.
About SHSE:603088
JDM JingDaMachine (Ningbo)Ltd
Produces and sells precision stamping parts in China and internationally.
Flawless balance sheet average dividend payer.
Market Insights

Community Narratives


