- China
- /
- Electrical
- /
- SHSE:600525
ChangYuan Technology Group (SHSE:600525) Might Have The Makings Of A Multi-Bagger


Finding a business that has the potential to grow substantially is not easy, but it is possible if we look at a few key financial metrics. Amongst other things, we'll want to see two things; firstly, a growing return on capital employed (ROCE) and secondly, an expansion in the company's amount of capital employed. If you see this, it typically means it's a company with a great business model and plenty of profitable reinvestment opportunities. So on that note, ChangYuan Technology Group (SHSE:600525) looks quite promising in regards to its trends of return on capital.
Understanding Return On Capital Employed (ROCE)
For those that aren't sure what ROCE is, it measures the amount of pre-tax profits a company can generate from the capital employed in its business. To calculate this metric for ChangYuan Technology Group, this is the formula:
Return on Capital Employed = Earnings Before Interest and Tax (EBIT) ÷ (Total Assets - Current Liabilities)
0.062 = CN¥388m ÷ (CN¥16b - CN¥10b) (Based on the trailing twelve months to March 2024).
Therefore, ChangYuan Technology Group has an ROCE of 6.2%. On its own that's a low return on capital but it's in line with the industry's average returns of 6.0%.
View our latest analysis for ChangYuan Technology Group
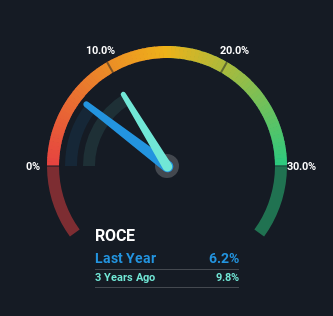
While the past is not representative of the future, it can be helpful to know how a company has performed historically, which is why we have this chart above. If you'd like to look at how ChangYuan Technology Group has performed in the past in other metrics, you can view this free graph of ChangYuan Technology Group's past earnings, revenue and cash flow.
How Are Returns Trending?
You'd find it hard not to be impressed with the ROCE trend at ChangYuan Technology Group. We found that the returns on capital employed over the last five years have risen by 5,261%. That's not bad because this tells for every dollar invested (capital employed), the company is increasing the amount earned from that dollar. Interestingly, the business may be becoming more efficient because it's applying 29% less capital than it was five years ago. If this trend continues, the business might be getting more efficient but it's shrinking in terms of total assets.
For the record though, there was a noticeable increase in the company's current liabilities over the period, so we would attribute some of the ROCE growth to that. Effectively this means that suppliers or short-term creditors are now funding 62% of the business, which is more than it was five years ago. And with current liabilities at those levels, that's pretty high.
The Bottom Line
In a nutshell, we're pleased to see that ChangYuan Technology Group has been able to generate higher returns from less capital. Given the stock has declined 31% in the last five years, this could be a good investment if the valuation and other metrics are also appealing. That being the case, research into the company's current valuation metrics and future prospects seems fitting.
On a final note, we found 2 warning signs for ChangYuan Technology Group (1 doesn't sit too well with us) you should be aware of.
If you want to search for solid companies with great earnings, check out this free list of companies with good balance sheets and impressive returns on equity.
New: AI Stock Screener & Alerts
Our new AI Stock Screener scans the market every day to uncover opportunities.
• Dividend Powerhouses (3%+ Yield)
• Undervalued Small Caps with Insider Buying
• High growth Tech and AI Companies
Or build your own from over 50 metrics.
Have feedback on this article? Concerned about the content? Get in touch with us directly. Alternatively, email editorial-team (at) simplywallst.com.
This article by Simply Wall St is general in nature. We provide commentary based on historical data and analyst forecasts only using an unbiased methodology and our articles are not intended to be financial advice. It does not constitute a recommendation to buy or sell any stock, and does not take account of your objectives, or your financial situation. We aim to bring you long-term focused analysis driven by fundamental data. Note that our analysis may not factor in the latest price-sensitive company announcements or qualitative material. Simply Wall St has no position in any stocks mentioned.
About SHSE:600525
ChangYuan Technology Group
Changyuan Technology Group Ltd. researches and develops, manufactures, and services industrial and power systems in China.
Good value with worrying balance sheet.
